 网站地图
网站地图


-
铝合金具有优秀的综合力学性能、良好的抗腐蚀能力以及较好的加工性能[1-2],但密度相对传统钢材来说却更低,因此能够广泛应用于交通运输、航空航天这些对产品强度和轻量化有着较高要求的行业中。激光焊接凭借焊接热影响区较小、焊接质量好等特点而成为主流焊接方式之一[3-5]。尽管如此,由于铝合金的导热系数大、弹性模量低以及热膨胀系数大而导致在焊接过程中极易出现变形[6],在焊接铝合金薄板时该问题更是严重。
目前消除焊接变形的方法主要有随焊锤击法、反变形法、刚性固定法、焊前预热法等[7-12]。近年来,超声波凭借其在金属熔体中产生的空化效应、声流效应、热效应等[13-14]而逐渐被应用到焊接领域当中,目前超声波在焊接中的应用主要还是集中在改善焊接气孔缺陷、细化晶粒、提高接头强度[15-17]等方面,在抑制变形方面的研究还较少,但是已有的研究中已经证明了超声波抑制焊接变形的可行性。哈尔滨工业大学的LI[18]进行了实时超声冲击焊接试验,结果表明, 当超声波作用于弹塑性温度转变区时对最大主应力及纵向应力的减小效果最明显,在800W超声波作用下分别减小了20.92%和24.29%。华侨大学的HUANG[19]采用随焊超声波激振方法对LY12铝合金进行了焊接试验,结果表明, 当激振距离为22mm时,焊后试件的最大挠度仅为0.9mm,较常规焊接减小了89.6%。
针对铝合金薄板在激光焊接后的变形大问题,本文中以1mm厚6061铝合金薄板为研究对象展开了超声波辅助激光焊接试验研究,探究超声波抑制变形的作用,并探寻合适的工艺参量以获得变形较小的试件。
-
试验中所使用的材料为6061铝合金,试件尺寸为150mm×50mm×1mm,试件的化学成分如表 1所示。在焊前使用400#砂纸对试件表面进行打磨将氧化膜去除,随后用无水乙醇对试件进行擦拭和清洁,并在风干后的24h内完成焊接试验。
Table 1. Mass fraction table of chemical composition of 6061 aluminum alloy
material Si Fe Cu Mg Mn Cr Zn Ti Al 6061 0.004 0.007 0.0015 0.006~0.012 0.0015 0.0005~0.0035 0.0025 0.001 margin 试验中使用的激光器为YLS-8000型激光器,激光头为WHH10-N-FC150FF300型焊接头,超声波发生器采用SONIC2000WA-20型发生器, 该发生器的振动频率是20kHz,最大功率2000W。在焊接过程中,将焊接头与超声波振动头固定在KR30 HA六轴机器人上,而试件则通过夹具固定在试验平台上,通过控制机器人的移动来实现对试件的焊接。焊接时,通过控制机器人运动方向以及夹具将超声波振动头置于激光热源后端且距离热源35mm。焊接试验平台如图 1所示。
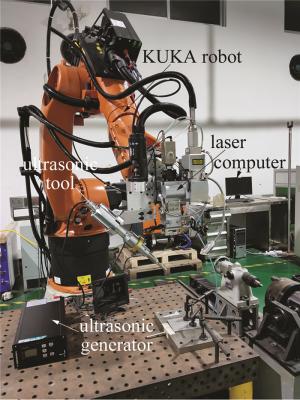
Figure 1. Ultrasonic assisted laser welding system
-
为了探究超声波的引入对焊接变形量的影响,采用了单因素试验方法,研究超声波功率的变化对焊接变形量的影响规律,焊接试验参量如表 2所示。试验过程中,还采用了背部吹气的方法以保证焊接质量,正面及背面保护气均采用纯度为99.9%的氩气。
Table 2. Single factor experiment parameters
processing parameters value ultrasonic power Pu 0W, 200W, 400W, 600W, 800W laser power P 1200W defocus amount Δ 0mm welding speed v 4m/min shielding gas flow rate Q1 10L/min blowing angle of shielding gas 45° back gas flow rate Q2 10L/min 为分析常规焊接参量及超声波功率对焊接变形量的影响程度, 并且获得控制焊接变形的最优工艺参量组合,设计了包括激光功率、离焦量、焊接速率、保护气流量及超声波功率在内的五因素五水平正交试验表,如表 3所示。
表 3 Orthogonal experiment parameters
experimental factor laser power P/W welding speed v /(mm·s-1) defocus amount Δ/mm shielding gas flow rate Q1/(L·min-1) ultrasonic power Pu/W level 1 1000 2 -2 0 0 level 2 1100 3 -1 5 200 level 3 1200 4 0 10 400 level 4 1300 5 1 15 600 level 5 1400 6 2 20 800 -
焊后残余内应力产生的原因主要有两个方面,分别是热导致的不均匀冷却而产生内应力,以及力导致的局部塑性变形[20],焊接残余内应力正是这两者的共同作用所引起,当内应力的大小超过焊件的临界失稳应力时,焊件就会发生失稳变形[21]。
试验中试件的焊后变形主要表现为挠曲变形及角变形,两者的最大值分别出现在与焊接方向平行的两边上及与焊接方向垂直的两边上,故本文中将待测试件放置于量板上,然后使用高度尺(由最小刻度为0.02mm的游标卡尺以及磁力座组成)分别对挠曲变形最大值所在边及角变形最大值所在边进行测量,将得到的最大值分别作为最终的挠曲变形量以及角变形量结果。
-
焊接变形量与超声波功率的关系如图 2所示。由图可以看到,在未施加超声波时,试件焊后产生的挠曲变形为5.5mm,角变形为2.39mm,施加超声波之后变形明显下降,而且随着超声波功率的增大,不论是挠曲变形还是角变形都在持续地降低,当超声波功率增加到800W时,试件的挠曲变形降低到了2.68mm,角变形则降低到了1.16mm。
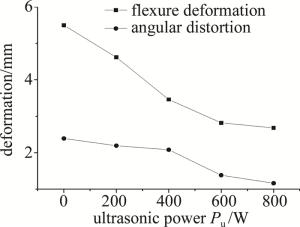
Figure 2. Influence of ultrasonic power on welding deformation
超声波对焊接变形的抑制作用主要体现在两个方面:一是当超声波振动头在焊缝中心处施加超声振动时,高频的振动将对焊缝产生持续的冲击,在冲击力的作用下,作用区域附近的金属将产生一层塑性应变层,同时引起受击位置产生微观的位错运动,使得该区域产生微观的塑性变形,这两部分塑性变形共同作用使得焊缝处的残余内应力得到释放而减小;二是焊缝在熔化及凝固的过程中超声波在其中产生的空化、声流以及热等效应,使得熔池的流动状态以及流动的剧烈程度发生改变,进而发生熔池温度梯度减小、焊缝不同区域的成分更均匀化等现象,受此影响,焊缝中的温度分布将更加均匀,组织偏析现象也得到了改善,组织分布更加均匀,因此, 热应力以及相变残余应力也都将会有所减小。在超声波功率增大的过程中,其对焊缝所产生的冲击力以及在熔池中产生的空化、声流和热等效应也有显著的增强,因而上述过程所产生的效果也会得到提高,故试件中的残余内应力将不断减小,最后宏观表现出来的结果就是试件的挠曲变形以及角变形在不断提高的超声波功率的作用下不断减小。
通过上述的分析可以初步认为, 使用超声波辅助激光焊接可以有效地减小焊件在激光焊接过程中所产生的变形,且该效果将随着超声波功率的增加而增强,因而为了在进行激光焊接时获得焊接变形较小的焊件,应该选择较大的超声波功率参量。各组试验结果如图 3所示。
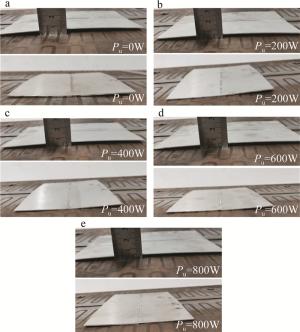
Figure 3. Single factor experiment results of ultrasonic power
-
为了探究常规焊接参量和超声波功率对焊接变形的影响程度以及获得能够得到最小边形量的最优工艺参量组合,设计了包括激光功率、焊接速率、离焦量、保护气流量以及超声波功率在内的五因素五水平L25(55)正交试验,正交试验各组参量及试验结果如表 4所示。
表 4 Result of orthogonal experiment
level factor A factor B factor C factor D factor E flexure deformation/mm angular deformation/mm laser power P/W welding speed v/(m·min-1) defocus amount Δ/mm shielding gas flow rate Q/(L·min-1) ultrasonic power Pu/W 1 1000 6 2 20 400 0.80 0.36 2 1000 2 -2 0 0 2.52 1.82 3 1000 5 1 15 800 0.42 0.26 4 1000 4 0 10 200 1.59 0.47 5 1000 3 -1 5 600 2.00 1.08 6 1100 3 2 0 400 3.31 1.74 7 1100 2 1 20 600 2.32 1.14 8 1100 6 0 15 0 0.78 0.47 9 1100 5 -1 10 200 1.58 0.56 10 1100 4 -2 5 800 1.74 0.70 11 1200 5 2 5 0 2.02 1.26 12 1200 3 0 20 800 1.92 0.87 13 1200 2 -1 15 400 3.02 2.00 14 1200 4 1 0 200 2.62 0.84 15 1200 6 -2 10 600 0.72 0.40 16 1300 2 2 10 800 3.46 1.35 17 1300 3 -2 15 200 3.68 1.60 18 1300 5 0 0 600 1.18 0.48 19 1300 4 -1 20 0 1.54 1.02 20 1300 6 1 5 400 0.88 0.32 21 1400 6 -1 0 800 0.54 0.42 22 1400 3 1 10 0 2.70 1.56 23 1400 4 2 15 600 2.20 1.53 24 1400 2 0 5 400 3.43 2.10 25 1400 5 -2 20 200 1.37 0.90 采用极差分析法对表 4中得到的结果进行分析。首先对每个因素中的每个水平所得到的挠曲变形量及角变形量进行求和并填入表 5中,其中挠曲变形量结果对应表 5中的Tik,角变形量则对应表 5中的Sik,下标i表示水平数,k表示因素数;随后计算各因素结果之和的极差并填入表 5中,其中挠曲变形量极差结果对应表 5中的RT,角变形量极差结果对应表 5中的RS。
Table 5. Analysis of orthogonal test results
summation and range of factor A/mm summation and range of factor B/mm summation and range of factor C/mm summation and range of factor D/mm summation and range of factor E/mm Ti1 7.33 14.75 11.79 10.17 9.56 Ti2 9.73 13.61 8.94 10.07 10.84 Ti3 10.30 9.69 8.90 10.05 11.44 Ti4 10.74 6.57 8.68 10.10 8.42 Ti5 10.24 3.72 10.03 7.95 8.08 RT 3.41 11.03 1.35 2.22 3.36 Si1 3.99 8.41 6.24 5.30 6.13 Si2 4.61 6.85 4.12 5.46 4.29 Si3 5.37 4.56 4.39 4.34 6.48 Si4 4.77 3.46 5.08 5.86 4.63 Si5 6.51 1.97 5.42 4.29 3.60 RS 2.52 6.44 2.12 1.57 2.92 极差对应了该因素对试验结果的影响程度,极差的数值越大,说明该因素越活泼,它的变化对试验结果的影响越大,反之说明该因素越保守,它的变化对试验结果的影响越小。因此,通过对表 5中的RT以及RS进行排序进而得到了各因素分别对试件焊后挠曲变形及角变形的影响程度的排序,结果如下:首先对于挠曲变形来说,对其影响最大的因素是焊接速率B因素,之后分别是激光功率A因素、超声波功率E因素、保护气流量D因素和离焦量C因素;而对角变形来说,对其影响最大的依然是焊接速率B因素,但是其它因素的影响程度与挠曲变形有所不同,后续的排序分别是超声波功率E因素、激光功率A因素、离焦量C因素和保护气流量D因素。
为了获得最优工艺参量组合,需要根据T值以及S值的大小来判断,由于试验需要得到的结果是焊后变形量最小的试件,因此, 应当是选择T值或者S值最小的那一水平作为最优水平。根据表 5中的结果可知,对于挠曲变形来说,其最优水平组合为:A1,B5,C4,D5,E5;而对于角变形来说,其最优水平组合为:A1,B5,C2,D5,E5,即理论上能够获得最小挠曲变形的最优工艺参量组合为:激光功率A1=1000W、焊接速率B5=6m/min、离焦量C4=-1mm、保护气流量D5=20L/min、超声波功率E5=800W。理论上能够获得最小角变形的最优工艺参量组合为:激光功率A1=1000W、焊接速率B5=6m/min、离焦量C2=+1mm、保护气流量D5=20L/min、超声波功率E5=800W。为了确定上述最优工艺参量组合的效果,采用上述两组工艺参量组合进行了试验,试验结果如表 6所示。
Table 6. Experimental results of theoretical optimal process parameters
experimental factor laser power/ W welding speed/ (m·min-1) defocus amount/ mm shielding gas flow rate/(L·min-1) ultrasonic power/ W flexure deformation/ mm angular distortion/ mm 1 1000 6 -1 20 800 0.50 0.33 2 1000 6 +1 20 800 0.58 0.30 从表 6可以看到,由理论最优工艺参量组合分别得到的挠曲变形量和角变形量均大于正交试验表中出现的最小值,因此,通过计算分析得到的工艺参量组合并非最优工艺参量组合,实际最优工艺参量组合应该为表 4中出现的第3组参量,即激光功率为1000W、焊接速率为5m/min、离焦量为+1mm、保护气流量为15L/min、超声波功率为800W,此参量下得到的试件的挠曲变形量为0.42mm,角变形量为0.26mm,结果如图 4所示。

Figure 4. Specimen with minimum deformation
-
图 5所示为不同超声波功率下试件的抗拉强度。在未施加超声波时,试件的抗拉强度仅为177.93MPa,施加超声波后抗拉强度显著提高,且随着超声波功率的增加,试件的抗拉强度也呈现提高的趋势,在超声波功率为800W时,试件的抗拉强度为199.2MPa,达到了母材的84.13%。
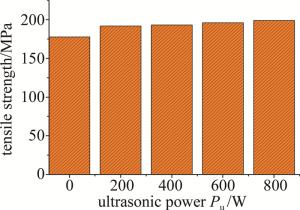
Figure 5. Effect of ultrasonic power on tensile strength of specimens
同时,为了判断获得的最小变形试件的拉伸性能是否满足应用要求,本文中采用了ISO 15614-2-2005标准,该标准针对不同组别的铝合金材料的拉伸强度应用要求进行了规定,具体评定标准如表 7所示。
Table 7. ISO 15614-2-2005 application standard of tensile strength for different groups of aluminum alloy
material group temper condition of parent material before welding post weld condition φ 21 all temper condition as welded 1 22 all temper condition as welded 1 23.1 T4 natural ageing 0.7 T4 artificial ageing 0.7 T5/T6 natural ageing 0.6 T5/T6 artificial ageing 0.7 23.2 T4 natural ageing 0.95 T4 artificial ageing 0.75 T6 natural ageing 0.75 T6 artificial ageing 0.75 表 7中φ表示接头效率系数,可以用公式φ=Rm, w/Rm, PM来表示,其中Rm, w表示处于焊后状态的焊接式样的抗拉强度,而Rm, PM表示母材的抗拉强度,从公式也可以看出, φ代表了焊后试件拉伸强度对母材拉伸强度的占比, 表中T4~T6分别为不同的金属热处理工艺状态。而为了判断本文中使用的材料属于哪一个组别,参照了ISO/TR 15608:2017标准,标准中所规定的分组细则如表 8所示。
表 8 ISO/TR 15608:2017 grouping system for aluminum and aluminum alloys
group subgroup type of aluminum and aluminum alloy 21 pure aluminum with w≤0.01 impurities or alloy content 22 non heat treatable alloys 22.1 aluminum-manganese alloys 22.2 aluminum-magnesium alloys with w(Mg)≤0.015 22.3 aluminum-magnesium alloys with 0.015<w(Mg)≤0.035 22.4 aluminum-magnesium alloys with w(Mg)>0.035 23 heat treatable alloys 23.1 Al-Mg-Si alloys 23.2 Al-Zn-Mg alloys 24 24.1 aluminum-silicon alloys with w(Cu)≤0.01 aluminum-silicon alloys with w(Cu)≤0.01 and 0.05<w(Si)≤0.15 24.2 aluminum-silicon-magnesium alloys with w(Cu)≤ 0.01;0.05<w(Si)≤0.15 and 0.001<w(Mg)≤0.008 25 aluminum-silicon-copper alloys with 0.05<w(Si)≤0.14;0.01<w(Cu)≤0.05 and w(Mg)≤0.008 26 aluminum-copper alloys with 0.02<w(Cu)≤0.06 本文中所使用的6061铝合金属于Al-Mg-Si铝合金,因此按照表 8的分组规则应当属于23.1组别的铝合金,再对照表 7可知,试件的拉伸强度至少应该达到母材的70%(即165.75MPa),才能够符合实际应用的要求。
将第2.2节中正交试验各组参量所得到的试件按照变形量有小到大进行排序,取其中的前5组进行拉伸试验,即对应正交试验中的第3组、第21组、第15组、第8组、第1组试验,拉伸试验结果如表 9所示。
Table 9. Results of tensile strength of specimens with small deformation
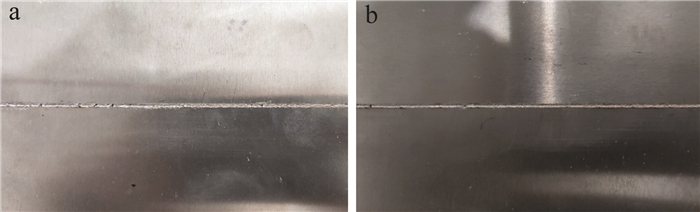
experimental factor tensile strength/MPa 3 154.35 21 189.78 15 175.39 8 168.64 1 162.56 由表 9中的数据可以看到,试验编号为3号和1号的试件的抗拉强度没有达到应用要求,且试件的拉伸强度并没有随着焊接变形的增大而呈现规律性变化,因此推测焊接变形与试件的抗拉强度之间并没有明显的联系。为探究上述两组试件抗拉强度不合格原因,后续转向了观察焊缝的表面成形,结果发现这两组试件的焊缝成形与其它组相比焊缝较窄,出现了多处焊漏的现象,焊缝成形质量较差,如图 6所示,这主要是由于在焊接这两组试件时所使用的激光功率过小而且焊接速度过大造成的,进而导致了焊缝的强度较低。因此,从上述分析可知,在实际应用当中, 不能仅为了实现变形小的目的而采取过于极端的工艺参量从而导致焊接质量的下降,而是应该兼顾这两者,在保证焊接质量的前提下再考虑将焊接变形降低。

Figure 6. Weld front morphology of unqualified test piece
-
(1) 施加超声波可以显著减小焊接变形,且随着超声波功率的增大抑制变形的效果也逐渐增强,当超声波功率为800W时,挠曲变形由无超声时的5.5mm下降到了2.68mm,减小了51.27%;角变形则由2.39mm下降到了1.16mm,减小了51.46%。
(2) 通过正交试验得到了超声波功率和常规焊接参量对焊接变形量的影响程度。其中,对挠曲变形来说,5个因素对其的影响程度由大到小的排序为:焊接速率、激光功率、超声波功率、保护气流量、离焦量;而对角变形来说, 排序则为:焊接速率、超声波功率、激光功率、离焦量和保护气流量。通过分析正交试验结果得到了能够实现最小变形的最优工艺参量组合,即激光功率为1000W、焊接速率为5m/min、离焦量为+1mm、保护气流量为15L/min、超声波功率为800W,对应试件的挠曲变形为0.42mm,角变形为0.26mm。
(3) 施加超声波可以明显提高试件接头的抗拉强度,当超声波功率为800W时,抗拉强度为199.2MPa,可以达到母材的84.13%。经过测试,最小变形试件并不能满足试件应用的拉伸强度要求,在实际应用中应当首先保证焊缝成形质量再考虑减小变形。
6061铝合金超声波辅助激光焊接变形控制研究
Research on deformation control of ultrasonic-assisted laser welding of 6061 aluminum alloy
-
摘要: 为了解决6061铝合金在激光焊接过程中出现的易变形、变形大的问题,采用施加超声波以辅助焊接的方法,以1mm厚的6061铝合金薄板为研究对象展开超声波辅助激光焊接试验,探究超声波对6061铝合金焊接变形的抑制作用;利用单因素试验方法分析了超声波功率对焊接变形的影响规律,设计包括超声波功率、激光功率、焊接速率、离焦量、保护气流量在内的五因素五水平正交试验,分析了超声波功率以及常规焊接参量分别对焊接变形的影响程度,并获得了能够得到最小变形的工艺参量组合。结果表明,焊接变形会随着超声波功率的增加而减小,超声波功率800W时较无超声情况下试件的挠曲变形及角变形分别减小了51.27%和51.46%;同时,当激光功率为1000W、焊接速率为5m/min、离焦量为+1mm、保护气流量为15L/min、超声波功率为800W时, 可以获得变形最小的试件,所得到的试件挠曲变形量为0.42mm,角变形量为0.26mm。此研究为超声波辅助焊接在控制薄板焊接变形方面的应用提供了一定的工艺和理论参考。Abstract: In order to solve the problem of easy deformation and large deformation of 6061 aluminum alloy in the laser welding process, ultrasonic assisted laser welding experiment was carried out with 1mm thick 6061 aluminum alloy sheet as the research object to explore the inhibition effect of ultrasonic on welding deformation of 6061 aluminum alloy. The influence of ultrasonic power on welding deformation was analyzed by single factor test method. Five factors and five levels orthogonal test including ultrasonic power, laser power, welding speed, defocusing amount, and shielding gas flow wer designed. The influence degree of ultrasonic power and conventional welding parameters on welding deformation was analyzed, and the process parameters combination which can obtain the minimum deformation were obtained. The results show that the welding deformation decreases with the increase of ultrasonic power, and the bending deformation and angular deformation of the specimen are reduced by 51.27% and 51.46% respectively when the ultrasonic power is 800W.At the same time, when the laser power is 1000W, the welding speed is 5m/min, the defocusing amount is + 1mm, the shielding gas flow rate is 15L/min, and the ultrasonic power is 800W, the minimum deformation of the specimen can be obtained, and the bending deformation is 0.42mm, and the angular deformation is 0.26mm. This study provides a certain technological and theoretical reference for the application of ultrasonic assisted welding in controlling welding deformation of thin plates.
-
Figure 6. Weld front morphology of unqualified test piece
a—No.3 test piece b—No.1 test piece
Table 1. Mass fraction table of chemical composition of 6061 aluminum alloy
material Si Fe Cu Mg Mn Cr Zn Ti Al 6061 0.004 0.007 0.0015 0.006~0.012 0.0015 0.0005~0.0035 0.0025 0.001 margin  下载: 导出CSV
Table 2. Single factor experiment parameters
processing parameters value ultrasonic power Pu 0W, 200W, 400W, 600W, 800W laser power P 1200W defocus amount Δ 0mm welding speed v 4m/min shielding gas flow rate Q1 10L/min blowing angle of shielding gas 45° back gas flow rate Q2 10L/min
下载: 导出CSV
表 3 Orthogonal experiment parameters
experimental factor laser power P/W welding speed v /(mm·s-1) defocus amount Δ/mm shielding gas flow rate Q1/(L·min-1) ultrasonic power Pu/W level 1 1000 2 -2 0 0 level 2 1100 3 -1 5 200 level 3 1200 4 0 10 400 level 4 1300 5 1 15 600 level 5 1400 6 2 20 800
下载: 导出CSV
表 4 Result of orthogonal experiment
level factor A factor B factor C factor D factor E flexure deformation/mm angular deformation/mm laser power P/W welding speed v/(m·min-1) defocus amount Δ/mm shielding gas flow rate Q/(L·min-1) ultrasonic power Pu/W 1 1000 6 2 20 400 0.80 0.36 2 1000 2 -2 0 0 2.52 1.82 3 1000 5 1 15 800 0.42 0.26 4 1000 4 0 10 200 1.59 0.47 5 1000 3 -1 5 600 2.00 1.08 6 1100 3 2 0 400 3.31 1.74 7 1100 2 1 20 600 2.32 1.14 8 1100 6 0 15 0 0.78 0.47 9 1100 5 -1 10 200 1.58 0.56 10 1100 4 -2 5 800 1.74 0.70 11 1200 5 2 5 0 2.02 1.26 12 1200 3 0 20 800 1.92 0.87 13 1200 2 -1 15 400 3.02 2.00 14 1200 4 1 0 200 2.62 0.84 15 1200 6 -2 10 600 0.72 0.40 16 1300 2 2 10 800 3.46 1.35 17 1300 3 -2 15 200 3.68 1.60 18 1300 5 0 0 600 1.18 0.48 19 1300 4 -1 20 0 1.54 1.02 20 1300 6 1 5 400 0.88 0.32 21 1400 6 -1 0 800 0.54 0.42 22 1400 3 1 10 0 2.70 1.56 23 1400 4 2 15 600 2.20 1.53 24 1400 2 0 5 400 3.43 2.10 25 1400 5 -2 20 200 1.37 0.90
下载: 导出CSV
Table 5. Analysis of orthogonal test results
summation and range of factor A/mm summation and range of factor B/mm summation and range of factor C/mm summation and range of factor D/mm summation and range of factor E/mm Ti1 7.33 14.75 11.79 10.17 9.56 Ti2 9.73 13.61 8.94 10.07 10.84 Ti3 10.30 9.69 8.90 10.05 11.44 Ti4 10.74 6.57 8.68 10.10 8.42 Ti5 10.24 3.72 10.03 7.95 8.08 RT 3.41 11.03 1.35 2.22 3.36 Si1 3.99 8.41 6.24 5.30 6.13 Si2 4.61 6.85 4.12 5.46 4.29 Si3 5.37 4.56 4.39 4.34 6.48 Si4 4.77 3.46 5.08 5.86 4.63 Si5 6.51 1.97 5.42 4.29 3.60 RS 2.52 6.44 2.12 1.57 2.92
下载: 导出CSV
Table 6. Experimental results of theoretical optimal process parameters
experimental factor laser power/ W welding speed/ (m·min-1) defocus amount/ mm shielding gas flow rate/(L·min-1) ultrasonic power/ W flexure deformation/ mm angular distortion/ mm 1 1000 6 -1 20 800 0.50 0.33 2 1000 6 +1 20 800 0.58 0.30
下载: 导出CSV
Table 7. ISO 15614-2-2005 application standard of tensile strength for different groups of aluminum alloy
material group temper condition of parent material before welding post weld condition φ 21 all temper condition as welded 1 22 all temper condition as welded 1 23.1 T4 natural ageing 0.7 T4 artificial ageing 0.7 T5/T6 natural ageing 0.6 T5/T6 artificial ageing 0.7 23.2 T4 natural ageing 0.95 T4 artificial ageing 0.75 T6 natural ageing 0.75 T6 artificial ageing 0.75
下载: 导出CSV
表 8 ISO/TR 15608:2017 grouping system for aluminum and aluminum alloys
group subgroup type of aluminum and aluminum alloy 21 pure aluminum with w≤0.01 impurities or alloy content 22 non heat treatable alloys 22.1 aluminum-manganese alloys 22.2 aluminum-magnesium alloys with w(Mg)≤0.015 22.3 aluminum-magnesium alloys with 0.015<w(Mg)≤0.035 22.4 aluminum-magnesium alloys with w(Mg)>0.035 23 heat treatable alloys 23.1 Al-Mg-Si alloys 23.2 Al-Zn-Mg alloys 24 24.1 aluminum-silicon alloys with w(Cu)≤0.01 aluminum-silicon alloys with w(Cu)≤0.01 and 0.05<w(Si)≤0.15 24.2 aluminum-silicon-magnesium alloys with w(Cu)≤ 0.01;0.05<w(Si)≤0.15 and 0.001<w(Mg)≤0.008 25 aluminum-silicon-copper alloys with 0.05<w(Si)≤0.14;0.01<w(Cu)≤0.05 and w(Mg)≤0.008 26 aluminum-copper alloys with 0.02<w(Cu)≤0.06
下载: 导出CSV
Table 9. Results of tensile strength of specimens with small deformation
experimental factor tensile strength/MPa 3 154.35 21 189.78 15 175.39 8 168.64 1 162.56
下载: 导出CSV
-
[1] LIN J B. Aluminum alloy welding technology research[J]. World Nonferrous Metals, 2017(8): 76-78(in Chinese). [2] ZHANG W, YE B, QI X Y, et al. Study on the effect of energy ratio in laser-MIG hybrid welding of 6061 aluminium alloy[J]. Laser Technology, 2018, 42(4): 500-504(in Chinese). [3] WANG X H, GU X Y, SUN D Q. Research on interface characteristic of laser welding joints of steel/aluminum dissimilar materials[J]. Journal of Mechanical Engineering, 2017, 53(4): 26-33(in Chinese). doi: 10.3901/JME.2017.04.026 [4] LEI Z, LI Y, CHEN Y, et al. Effect of process parameters on porosity formation ratio in dual-beam laser welding of aluminum alloys with filler wire[J]. Transactions of the China Welding Institution, 2013, 34(2): 40-44. [5] SU Sh X, YU Y L, FEI W, et al. Research of characteristics of weld formation of aluminum alloy by high power fiber laser welding[J]. Laser Technology, 2017, 41(3): 322-327(in Chinese). [6] YE H Y, HE J, CAI J P, et al. Welding deformations of 6061-T651 Al alloy thin-plate joints[J]. The Chinese Journal of Nonferrous Metals, 2014, 24(10): 2435-2442(in Chinese). [7] LI Sh L, MA Y J, WANG D Y, et al. Influence of welding with trailing peening on welding stress based on electromagnetism control[J]. Welding Technology, 2008, 37(4): 66-68(in Chinese). [8] HE X M, WANG Y M, ZHANG C H. Influence of high energy shot peening on microstructure and properties of TC4 welded joints[J]. Transactions of the China Welding Institution, 2016, 37(6): 40-44(in Chinese). [9] LI J Y, LU Y M, LIU Z P, et al. Residual stresses and distortions in aluminum alloy sheet after welding under pre-tension[J]. Materials Science Forum, 2009, 618/619: 45-48. doi: 10.4028/www.scientific.net/MSF.618-619.45 [10] LIU X D, TAO X H, HAN Zh Q. Application of vibratory stress relief in relaxation of residual stress for expandable corrugated liners[J]. Journal of Vibration and Shock, 2015, 34(4): 171-174(in Chinese). [11] JI P, JI H. Study on welding residual stress and welding deformation control of steel structure[J]. World Nonferrous Metals, 2017(3): 191-193(in Chinese). [12] JIANG Y F, DING B, CHENG Zh J, et al. Effect of laser peening area on residual stress field in small-hole specimens[J]. Laser Technology, 2014, 38(2): 201-204(in Chinese). [13] LI Zh, LIU J, BAI Ch M, et al. Study on effect of ultrasonic on laser-arc hybrid welding of aluminum alloy[J]. Laser Technology, 2019, 43(3): 301-306(in Chinese). [14] LIU H D, HU F Y, LI H B, et al. Classification research and the application summarization of power ultrasonic technology[J]. Electric Welding Machine, 2014, 44(12): 31-35(in Chinese). [15] ZHAO Zh Q, YAN X, LI D, et al. Effect of the front trailing ultrasonic impact treatment on welding residual stress and deformation[J]. Electric Welding Machine, 2019, 49(5): 79-83(in Chinese). [16] GE H L. Study on microstructure of weld joint of aluminum alloy and research of mechanism of ultrasonic impact[D]. Harbin Institute of Technology, 2016: 17-30(in Chinese). [17] GAO S, WU C S, PADHY G K. Material flow, microstructure and mechanical properties of friction stir welded AA 2024-T3 enhanced by ultrasonic vibrations[J]. Journal of Manufacturing Processes, 2017, 30: 385-395. doi: 10.1016/j.jmapro.2017.10.008 [18] LI S H. Effect of real time ultrasonic impact treatment on welding residual stress, deformation and microstructure property[D]. Haerbin: Harbin Institute of Technology, 2014: 32-44(in Chinese). [19] HUANG H H. Study on controlling of welding stress and distortion for aluminum alloy by welding with trailing ultrasonic vibration[D]. Quanzhou: Huaqiao University, 2014: 50-56(in Chinese). [20] LIU Y, SHEN N J. Residual stresses analysis for actual material model of autofrettaged tube by non-linear boundary element method[J]. Elsevier, 1991, 48(1): 10-25. [21] LIU X X. Study on the control of laser welding deformation of titanium alloy thin sheet[D]. Changsha: Hunan University, 2014: 9-11(in Chinese). -

 点击查看大图

计量
- 文章访问数: 5848
- HTML全文浏览量: 3217
- PDF下载量: 47
- 被引次数: 0
