Advanced Search

ISSN1001-3806 CN51-1125/TN Map

Volume 43 Issue 6
Nov.  2019
Article Contents
Turn off MathJax

Citation:

Application of micro near infrared spectrometer in measuring sugar content of apple

  • Corresponding author: HUANG Meizhen, mzhuang@sjtu.edu.cn
  • Received Date: 2019-01-24
    Accepted Date: 2019-01-30
  • In order to evaluate the feasibility of miniature near infrared spectroscopy (NIRS) in detecting sugar content of fruits in situ, non-destructive, high-precision and fast detection method of apple sugar content was established by combining particle swarm optimization with back propagation (BP) neural network. The spectral data obtained by NIRscan(micro-NIRS) using single wavelength measurement mode and Hadamard transform measurement mode were studied. A variety of different data preprocessing methods and multiple linear regression, partial least squares, particle swarm optimization (PSO), BP neural network and other algorithms were used to establish the analysis model. The results show that the spectral data obtained by the working mode of Hadamard transform are better. First derivative combined with Savizky-Golay smoothing algorithm is used for data preprocessing. The prediction model of apple sugar content based on PSO and BP neural network has higher prediction accuracy. Predictive correlation coefficient and root mean square error are 0.9911 and 0.1502, respectively. NIRscan (micro-NIRS) is feasible for rapid and high-precision non-destructive testing of apple sugar content in the field.
  • 加载中
  • [1]

    LU W Zh. Modern near infrared spectroscopy analysis technology[M]. Beijing: China Petrochemical Press, 2007: 1-14(in Chin-ese).
    [2]

    SCHMUTZLER M, HUCK C W. Simultaneous detection of total antioxidant capacity and total soluble solids content by Fourier transform near-infrared (FT-NIR) spectroscopy: A quick and sensitive method for on-site analyses of apples[J]. Food Control, 2016, 66:27-37. doi: 10.1016/j.foodcont.2016.01.026
    [3]

    GRASSI S, ALAMPRESE C. Advances in NIR spectroscopy applied to process analytical technology in food industries[J]. Current Opi-nion in Food Science, 2018, 22:17-21. doi: 10.1016/j.cofs.2017.12.008
    [4]

    LI X F, HUANG M Zh, SHI M M. Application of wavelet analysis in measurement of glucose concentration in human serum by short-wave near infrared spectra[J]. Acta Laser Biology Sinica, 2010, 19(1):110-114(in Chinese).
    [5]

    LIU Y D, XU H, SUN X D, et al. Non-destructive measurement of tomato maturity by near-infrared diffuse transmission spectroscopy[J]. Laser Technology, 2019, 43(1): 25-29(in Chinese).
    [6]

    XU X Q, CHEN G, ZHANG H. The development and latest progress of near infrared spectrometer[J]. Anhui Chemical Industry, 2017, 43(4): 7-10(in Chinese).
    [7]

    YU X Y, LU Q P, GAO H Zh. Current status and prospects of port-able NIR spectrometer[J]. Spectroscopy and Spectral Analysis, 2013, 33(11):2983-2988 (in Chinese).
    [8]

    SHI M M, HUANG M Zh. Design of a small rapid scanning near infrared spectroscopy[J]. Acta Photonica Sinica, 2011, 40(4):591-595(in Chinese). doi: 10.3788/gzxb20114004.0591
    [9]

    ZHAO J W, ZHANG H D, LIU M H. Non-destructive determination of sugar contents of apples using near inf rared diffuse reflectance[J]. Transactions of the Chinese Society of Agricultural Engineering, 2005, 21(3): 162-165(in Chinese).
    [10]

    LIU Y D, YING Y B, FU X P. Study on predicting sugar content and valid acidity of apples by near infrared diffuse reflectance technique[J]. Spectroscopy and Spectral Analysis, 2005, 25(11):1793-1796(in Chinese).
    [11]

    WANG J H, HAN D H. Analysis of near infrared spectra of apple ssc by genetic algorithm optimization[J]. Spectroscopy and Spectral Analysis, 2008, 28(10): 2308-2311(in Chinese).
    [12]

    ZHANG H D, ZHAO J W, LIU M H. Near infrared determination of sugar content in apples based on orthogonal signal correction and partial least square(OSC/PLS) method[J]. Food Science, 2005, 26(6): 189-192(in Chinese).
    [13]

    LI Y X, ZOU X B, DONG Y. Near infrared determination of sugar content in apples based on GA-iPLS[J]. Spectroscopy and Spectral Analysis, 2007, 27(10): 2001-2004(in Chinese).
    [14]

    LIU Y D, ZHOU Y R. GA-LSSVM based near infrared spectroscopy detection of apple sugar content[J]. Journal of Northwest A&F University (Natural Science Edition), 2013, 41(7):229-234(in Ch-inese).
    [15]

    PEIRS A, SCHENK A, NICOLA B M. Effect of natural variability among apples on the accuracy of VIS-NIR calibration models for optimal harvest date predictions[J]. Postharvest Biology and Technology, 2005, 35(1):1-13. doi: 10.1016/j.postharvbio.2004.05.010
    [16]

    CHEN X, LIU F. Application of MIV method in near infrared analysis of apple TSC[J]. Computers and Applied Chemistry, 2012, 29(7):812-816(in Chinese).
    [17]

    SUN Y H, LIU Y Y, DING Y Q. Experimental study on near infrared spectroscopy detection of sugar degree of apple[J]. Journal of Food Safety and Quality, 2015(8):3021-3025(in Chinese).
    [18]

    WANG X D, LIU H, DANG B Sh. Miniature digital micro-mirror device hadamard transform near-infrared spectrometer[J]. Acta Optica Sinica, 2015, 35(5):388-394(in Chinese).
    [19]

    LIU J, CHEN F F, LIAO Ch Sh, et al. A Digital micromirror device-based hadamard transform near infrared spectrometer[J]. Spectroscopy and Spectral Analysis, 2011, 31(10):2874-2878(in Ch-inese).
    [20]

    LEI M, FENG X L, ZHANG X M, et al. Hadamard transform NIR spectroscopy instrument[J]. Modern Scientific Instruments, 2009(4):44-46(in Chinese).
    [21]

    WANG X M, WANG H F, YAO N F. Parameter optimization of laser displacement sensor based on particle swarm optimization algorithm[J]. Laser Technology, 2018, 42(2): 181-186(in Chin-ese).
    [22]

    JIANG X Sh. Improved particle swarm algorithms for multi-dimensional optimization problems[D]. Hangzhou: Zhejiang Sci-Tech University, 2016: 7-9(in Chinese).
    [23]

    HOU Y, ZHAO L, LU H W. Fuzzy neural network optimization and network traffic forecasting based on improved differential evolution[J]. Future Generation Computer Systems, 2018, 81: 425-432. doi: 10.1016/j.future.2017.08.041
  • 加载中
通讯作者: 陈斌, bchen63@163.com
  • 1. 

    沈阳化工大学材料科学与工程学院 沈阳 110142

  1. 本站搜索
  2. 百度学术搜索
  3. 万方数据库搜索
  4. CNKI搜索

Figures(6) / Tables(3)

Article views(15126) PDF downloads(84) Cited by()

Proportional views

Application of micro near infrared spectrometer in measuring sugar content of apple

    Corresponding author: HUANG Meizhen, mzhuang@sjtu.edu.cn
  • Department of Instrument Science and Engineering, School of Electronic Information and Electrical Engineering, Shanghai Jiao Tong University, Shanghai 200240, China

Abstract: In order to evaluate the feasibility of miniature near infrared spectroscopy (NIRS) in detecting sugar content of fruits in situ, non-destructive, high-precision and fast detection method of apple sugar content was established by combining particle swarm optimization with back propagation (BP) neural network. The spectral data obtained by NIRscan(micro-NIRS) using single wavelength measurement mode and Hadamard transform measurement mode were studied. A variety of different data preprocessing methods and multiple linear regression, partial least squares, particle swarm optimization (PSO), BP neural network and other algorithms were used to establish the analysis model. The results show that the spectral data obtained by the working mode of Hadamard transform are better. First derivative combined with Savizky-Golay smoothing algorithm is used for data preprocessing. The prediction model of apple sugar content based on PSO and BP neural network has higher prediction accuracy. Predictive correlation coefficient and root mean square error are 0.9911 and 0.1502, respectively. NIRscan (micro-NIRS) is feasible for rapid and high-precision non-destructive testing of apple sugar content in the field.

引言
  • 近红外光谱信息主要来源于分子中含氢基团的倍频和合频吸收,绝大多数化学和生物样品在此区域都有相应的吸收,因此,通过分析近红外吸收光谱可以对被测样品进行定性和定量。近红外光谱分析检测技术具有快速、无损、样品无需预处理等显著优点,具有广泛的应用和前景[1-5]

    目前,近红外光谱仪主要有滤光片型、光栅色散型、声光可调谐滤波型和傅里叶变换型[6]。便携式近红外光谱仪主要以光栅色散型为主[7],其中扫描光栅单点探测型的性价比较高,但缺点是光路含扫描运动部件,且扫描测量速度较慢;固定光栅阵列探测型不含扫描运动部件,测量速度快,但由于受探测器材料和器件技术的限制,波长大于1100nm近红外阵列探测器的价格还非常昂贵[8],广泛应用受到限制。美国TI公司研制的基于数字微镜器件(digital micro-mirror device, DMD)和阿达玛变换技术的新型近红外光谱仪,通过DMD与单元近红外探测器的组合实现光谱的快速扫描,阿达玛变换提升了光谱的信噪比,仪器性价比高,从而克服了上述不足。

    苹果糖度是苹果质量的重要评价指标,应用近红外光谱技术预测苹果糖度已有不少研究报道[9-17],其中ZHAO等人[9]使用美国Nicolet公司的Nexus 670傅里叶变换近红外光谱仪采集苹果光谱,采用偏最小二乘(partial least squares, PLS)建立校正模型,预测相关系数(correlation of prediction, CP)Rp=0.9387,预测均方根误差(root mean square error of prediction,RMSEP)σp=0.5054;LIU等人[10]以Nexus FT-IR光谱仪为测量仪器,建立了苹果糖度的PLS模型,Rp =0.906,σp=0.272;WANG等人[11]对苹果糖度建立了遗传-偏最小二乘算法(genetic algorithm-partial least squares, GA-PLS)模型,仪器使用Nicolet公司的Antaris FT-IR光谱仪,Rp=0.954,σp=0.797;ZHANG等人[12]使用Nexus 670 FT-IR光谱仪建立了苹果糖度的PLS模型,Rp=0.9264,σp=0.5023;LI等人[13]同样使用Nexus 670 FT-IR光谱仪建立了苹果糖度的遗传-区间偏最小二乘算法(genetic algorithm-interval partial least squares, GA-iPLS)模型,Rp =0.932,σp=0.3842。综上所述,目前对苹果糖度的研究大多使用大型傅里叶变换近红外光谱仪,该类型光谱仪价格昂贵、体积较大,不适合现场快速检测,且目前研究的模型建立方法单一,多采用偏最小二乘方法,未考虑光谱变量与糖度之间的非线性关系,模型的预测误差偏大。

    近红外光谱技术的发展趋势和目标是便携、快速、准确,本文中采用TI公司的DMD微型光谱仪NIRscan对苹果糖度测量进行研究,研究提高测量精度的数据分析方法,探讨微型近红外光谱仪应用于现场水果糖度检测的可行性。

1.   基于DMD的微型近红外光谱仪
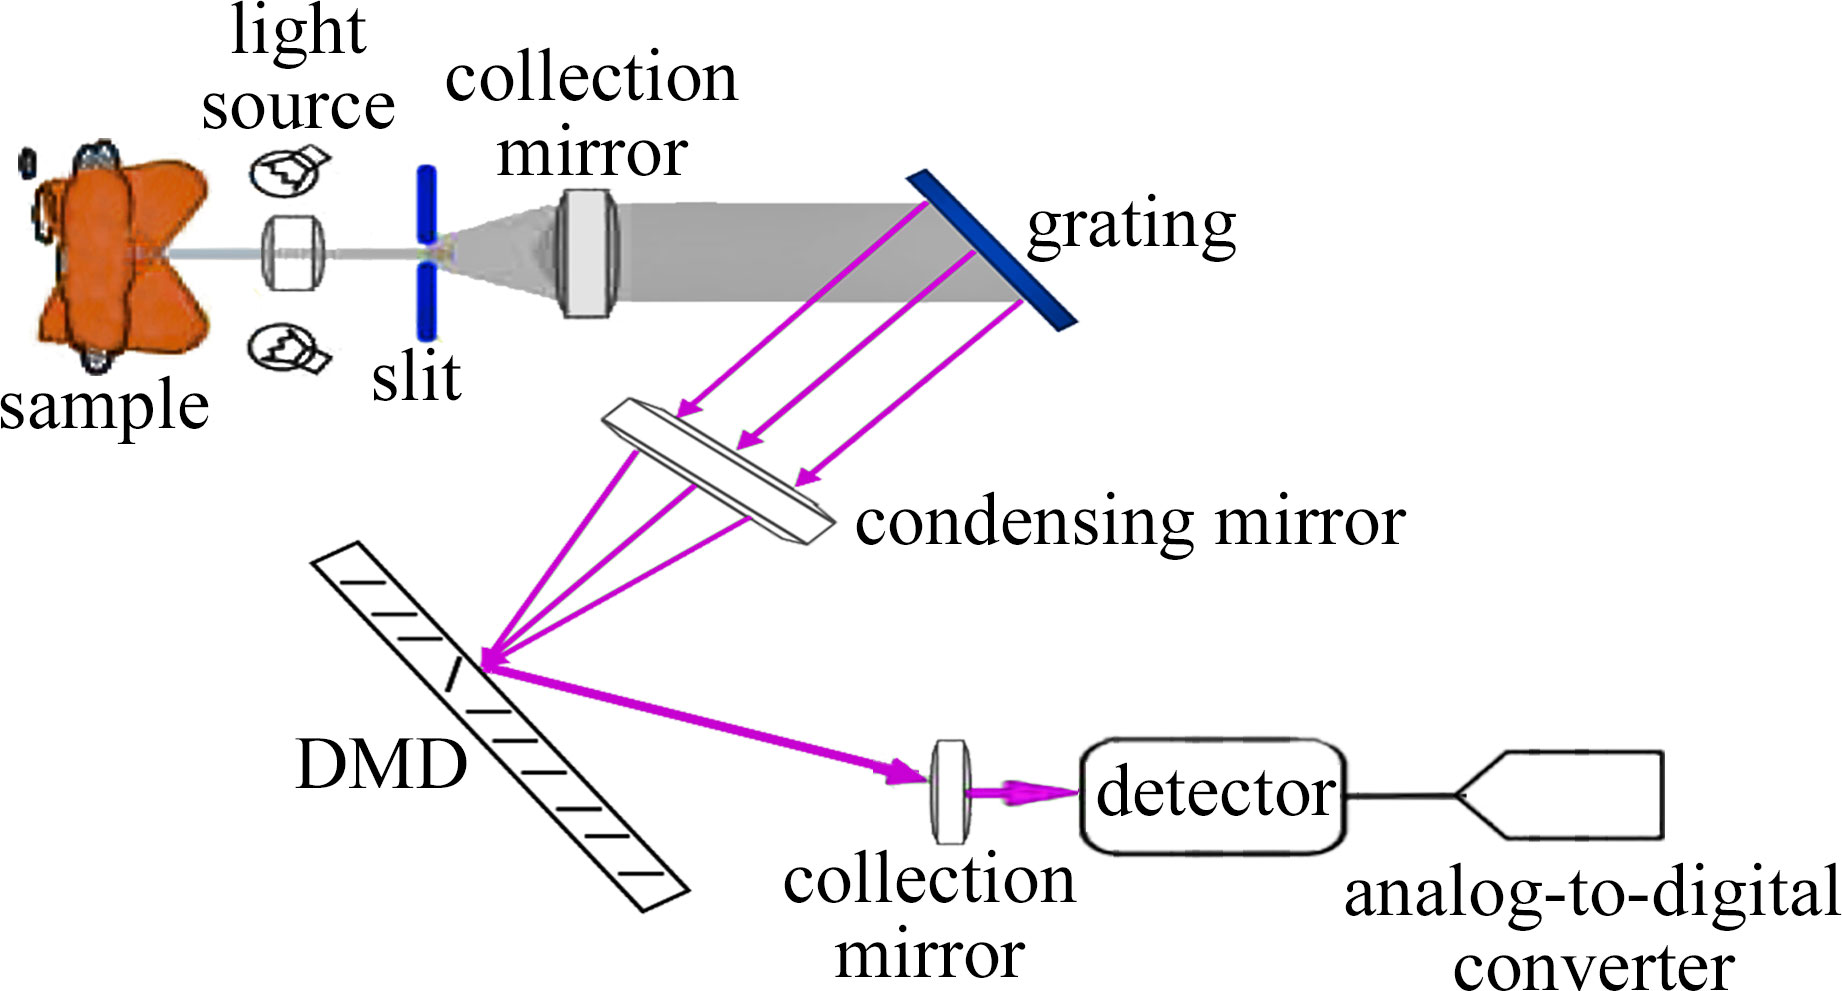
  • 基于DMD的阿达玛变换微型光谱仪[18]由光源、分光系统、成像系统、探测系统和光谱信息采集处理系统五部分组成,尺寸为62mm×58mm×36mm,整个光学系统的基本结构示意图如图 1所示。光源发出的光经过样品漫反射后经狭缝入射到分光成像系统,经准直镜准直为平行光,入射到光栅上,光栅将复色平行光分光,经透镜会聚,按波长顺序入射到DMD的不同像元位置,DMD为微型反射镜阵列芯片,以常规或者阿达玛变换等不同的编码矩阵模式控制DMD像元镜片翻转,从而对入射的光进行波长挑选,之后由透镜聚焦在单点探测器上进行光谱采集。检测出的光谱信号由计算机进行阿达玛逆变换解码,最终得到原始光谱信号。基于DMD的NIRscan微型光谱仪的探测器采用InGaAs单点探测器,其响应范围为900nm~1700nm,狭缝的宽度为25μm,分辨率为10nm。

    Figure 1.  Schematic illustration of DMD near-infrared spectrometer

  • 常规单波长模式测量是检测器在每一段时间间隔里只检测单个波长的信号强度,而阿达玛变换变换模式在同一时间里能够检测多个波长的信号的总强度。相同的实验条件下,经阿达玛变换后,信号的均方差可以减小(n+1)2/(4n)倍,信噪比可提高(n+1)/(2n)1/2[19],其中n为波长点数。

    用三波长光谱测量来解释阿达玛变换的原理[20],如图 2a所示,对应光谱波长λ1λ2λ3可以采用单次测量来获得每一波长的强度值。而阿达玛变换模式是每次测量其中两个光谱波长的强度值,如图 2b所示,3次独立测量后将得到3个线性无关的方程,将其写成矩阵形式, 如下式所示:

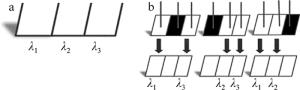
    Figure 2.  Measurement process

    式中,Y1, Y2, Y3为测量的强度值,1代表透光,0代表阻光。通过解矩阵方程,可以求得λ1λ2λ3的强度值。在实际中,用这种方法可以测成百上千个光谱波长对应的量值。

2.   试验与方法
  • 从市场上收集了山东红富士苹果21个,选取无病虫害、无机械损伤的苹果在其赤道圈表面选取3个测试区域(直径约10mm),每个区域单独作为一个样品。随机将48个样品作为校正集,15个样品作为验证集。

  • 用NIRscan微型光谱仪采集苹果的光谱,由光谱仪内置的两个钨灯光源发光,照射在样品上发生漫反射,返回的光经过微型光谱仪光路分光、成像并探测,探测器的信号传递给计算机,获得光谱数据。对每个样品在同一测试区域分别用常规单波长模式和阿达玛模式进行光谱采集,为减少误差,每个样品在每种模式下各采集3次,取其平均作为原始光谱。

  • 每个苹果在相应光谱扫描的位置挖取直径10mm、深5mm的圆柱形果肉样本,去皮挤汁并测出对应区域的糖度值。用LH-T32型手持糖度计测量糖度,将苹果汁滴至折光棱镜的镜面上调节目镜视度圈,于视场中所见蓝白分界线相应之读数,即为苹果糖度的百分数,其精度为0.2%。

  • 粒子群算法(particle swarm optimization, PSO)是基于鸟群觅食提出的一种优化算法,具有快速、易实现等特点,被广泛应用于极值问题、参量优化等问题的求解[21-22]。在PSO算法中,优化问题的每个潜在解都是搜索空间中的一个“粒子”,PSO方法首先随机初始化一群粒子,然后用指定的评价函数计算适应度值以确定是否达到寻优目标,然后判断是否需要继续迭代寻优。

    反向传播(back propagation,BP)神经网络是近红外光谱分析中应用最为广泛的神经网络,其主要由信号的正向传播和误差的反向传播组成。正向传播时,光谱数据从输入层传入,经隐含层处理后传向输出层,若实际输出与期望输出的误差较大,此时将误差反向传播,以修改各个神经单元的权值和阈值,直到网络的输出误差减小到规定的范围,或达到设定的学习次数为止。

    BP算法的学习过程是根据训练样本对初始权值阈值进行调整的过程,已有研究表明,初始权值阈值的选取会影响到BP模型的性能[23],因此初始权阈值的优化对于获得泛化能力强的BP模型是很重要的。本文中将粒子群算法与BP算法融合,采用PSO寻找最优的初始权值阈值,然后用BP算法训练得到模型最终的权值阈值。PSO-BP模型可以克服BP神经网络学习稳定性差、易陷入局部极小值的缺点。PSO-BP算法的基本流程如图 3所示。

    Figure 3.  Flow chart of PSO-BP algorithm

  • 本文中的数据处理均在MATLAB软件中完成,包括光谱预处理和模型建立。对于苹果糖度的校正模型,选择校正均方根误差(root mean square error of calibration, RMSEC)σc、预测均方根误差(RMSEP)σp、校正相关系数(correlation of calibration)Rc和预测相关系数Rp作为模型评价的标准,预测相关系数Rp越高且预测均方根误差(RMSEP)σp越小,模型的预测能力越强。

3.   结果与分析
  • 有关苹果糖度的参量如表 1所示,包括糖度的范围、平均值、标准差和变异系数,由表 1可知, 校正集的苹果的平均值是13.46,标准差为1.04,预测集的平均值为12.75,标准差为1.2。

    data set number of sample minimum maximum mean standard deviation
    calibration set 48 11.2 15.2 13.46 1.04
    validation set 15 11 15 12.75 1.20

    Table 1.  Distribution of sugar content in apple samples

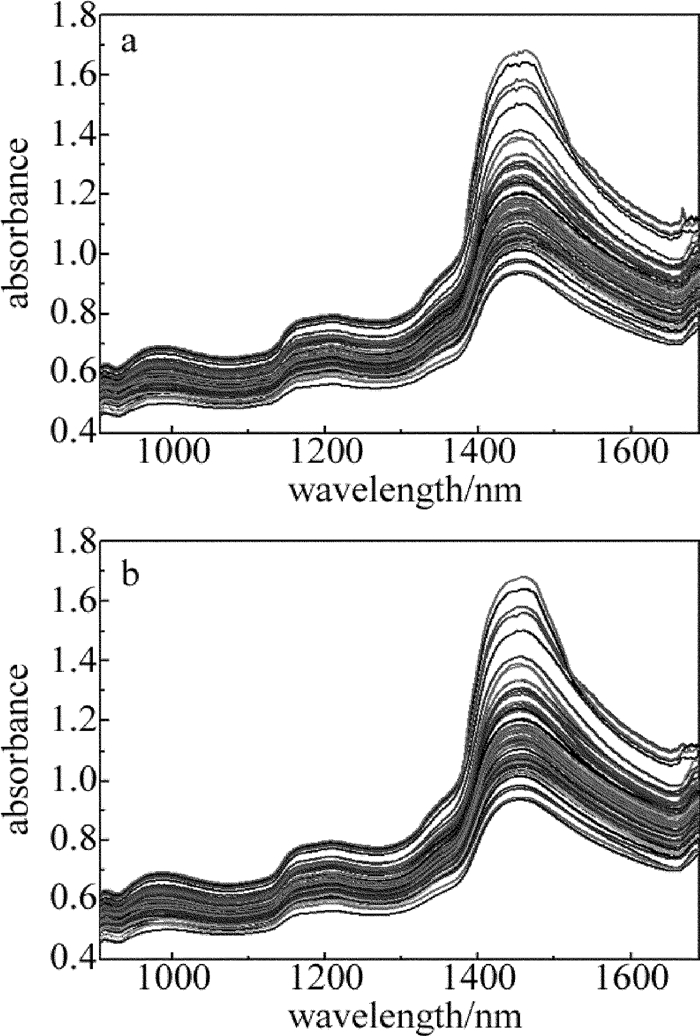
  • 为保证实验结果的准确性,采集光谱应保证在相同的实验条件下进行,图 4a为63个苹果样品采用常规单波长模式下的苹果谱图,图 4b为同批样品在相同实验条件和阿达玛变换模式下的苹果光谱图。对比两图可知,不同模式下的苹果光谱图大体形状十分接近,而阿达玛模式下采集的光谱图较常规单波长模式下的光谱图更为光滑。

    Figure 4.  a—apple spectra obtained by normal mode b—apple spectra obtained by Hadamard mode

  • 采集的近红外光谱信号不仅包含样品组成相关的信息,而且也引入了由于样品状态、杂散光以及仪器响应等因素的差异而产生的噪声和基线偏移等干扰信息,因而需要在建模前对光谱数据进行预处理来消除干扰信息的影响。进行适当的预处理有利于提高模型的精度及稳定性。本实验中使用了Savizky-Golay(S-G)平滑、1阶求导、标准正态变量变换(standard normal variate transformation, SNV)以及多元散射校正(multiplicative scatter correction, MSC)等预处理方法,对其建模效果进行了比较,最终选择1阶求导结合S-G平滑的预处理方法,S-G平滑窗口数为5。

  • 在建立3层BP神经网络时,为了减小运算量提高运算效率,采用主成分分析对光谱数据进行降维处理,得到主成分数为7时,其累计总贡献率达到99.83%,能够较好地代表原始光谱信息,因此选择贡献率较大的前7个主成分作为BP网络的输入,即输入层的神经元个数为7。隐含层神经元个数经网络测试确定为10,输出层神经元个数为1。隐含层和输出层的传递函数分别为tansig和purelin激励函数,网络的训练方法采用梯度下降法,学习速率取0.05,训练目标为0.001,最大迭代次数为1000。由神经网络的规模可确定粒子群的维度为91,取粒子群中粒子的个数为30,以训练均方根误差作为粒子的适应度评价函数。

    表 2中列出了用PSO-BP算法结合多种预处理方法对两种模式下的光谱数据进行建模分析的结果。由表 2可知,阿达玛变换模式下的模型较常规单波长模式下的模型,不论是原始数据还是经过预处理后数据,其得到的预测相关系数都更高,预测标准差更小,模型的预测精度和稳定程度更高。这与阿达玛变换较常规模式信号均方差更小、信噪比更高的特点相对应。此外阿达玛模式下经1阶导数+S-G平滑预处理后的PSO-BP模型预测效果最好,其中预测集的相关系数为0.9911,校正均方根误差为0.1502。

    pretreatmentmethod calibration set validation set
    Rc σc Rp σp
    single wavelength Hadamard transform single wavelength Hadamard transform single wavelength Hadamard transform single wavelength Hadamard transform
    none 0.8790 0.9401 0.7045 0.4177 0.7944 0.8732 0.9601 0.7290
    S-G smoothing 0.9035 0.9522 0.6634 0.3675 0.8382 0.9098 0.8664 0.6652
    SNV 0.8377 0.8612 0.8672 0.7523 0.7845 0.8325 0.9914 0.8631
    MSC 0.8406 0.8809 0.8043 0.9588 0.7867 0.8451 0.9856 0.7935
    the 1st derivative+S-G smoothing 0.9684 0.9983 0.3051 0.0956 0.9566 0.9911 0.3589 0.1502
    the 1st derivative+SNV 0.8534 0.9214 0.7852 0.5412 0.8123 0.8813 0.8927 0.9057
    the 1st derivative+MSC 0.8631 0.9352 0.7512 0.4906 0.8265 0.8925 0.8716 0.8541

    Table 2.  Modeling results obtained by single wavelength mode and Hadamard transform mode

    表 3中列出了PSO-BP模型与其它模型的比较结果,与多元线性回归(multiple linear regression, MLR)、偏最小二乘法(PLS)相比,优化的神经网络模型整体性能更好,预测精度高误差小;对于简单的BP神经网络模型,校正集的相关系数和均方根误差都较好,然而对于验证集的预测效果较差,出现明显的过拟合现象,可能是由于BP网络在训练过程中陷入局部最优的原因;PSO-BP模型在粒子群算法的优化下,取得良好的预测效果,模型的稳定性高,泛化能力强。图 5为PSO-BP模型的预测糖度值和实际测量值的相关系数图。

    models calibration set validation set
    Rc σc Rp σp
    MLR 0.8722 0.7589 0.8031 0.9547
    PLS 0.9523 0.3612 0.9012 0.6718
    BP 0.9845 0.1877 0.7313 1.2514
    PSO-BP 0.9983 0.0956 0.9911 0.1502

    Table 3.  Comparison of results using a PSO-BP model and other models

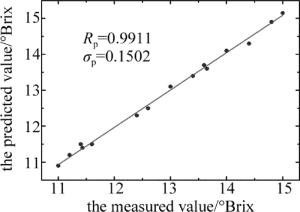
    Figure 5.  The measured value by LH-T32 portable Brix meter vs. the predicted values by our procedure

4.   结论
  • 本文中采用DMD微型近红外光谱仪NIRscan检测苹果糖度,应用粒子群算法结合BP神经网络建立了苹果糖度的高精度预测模型。DMD微型光谱仪具有体积小、速度快、性能稳定、价格低等优势,对比其在单波长的常规模式和阿达玛变换模式两种不同工作模式的测量结果,阿达玛模式下的光谱数据信噪比更高,信号均方差更小。PSO-BP模型的性能优于MLR, PLS, BP等模型,预测精度高、误差小,模型预测相关系数和均方根误差分别为0.9911和0.1502。结果表明,DMD微型近红外光谱仪NIRscan结合阿达玛变换模式下的PSO-BP模型在水果品质检测中的应用具有可行性,DMD近红外光谱仪有望成为更为理想的新一代应用广泛的微型近红外光谱仪。

Reference (23)

Catalog

    /

    DownLoad:  Full-Size Img  PowerPoint
    Return
    Return