Advanced Search

ISSN1001-3806 CN51-1125/TN Map

Volume 43 Issue 6
Nov.  2019
Article Contents
Turn off MathJax

Citation:

Multipass absorption spectroscopy based on calibration- free wavelength modulation

  • Corresponding author: LI Chuanliang, clli@tyust.edu.cn
  • Received Date: 2018-12-25
    Accepted Date: 2019-01-25
  • In order to study the immunity of calibration-free wavelength modulation spectroscopy to laser intensity change and external interference, multi-path absorption spectra based on calibration-free wavelength modulation technology were adopted. Taking acetylene as the measurement target, theoretical analysis and experimental verification were carried out. The results show that, the amplitude of wavelength modulated second harmonic signal varies significantly under different laser power. But the signal obtained by the calibration-free method changes little. It is less affected by external disturbance such as airflow, partial shading and system vibration. The spectral signals with volume fraction in the range of 5×10⁻⁶ ~9×10⁻⁵ obtained by calibration-free method have good linearity. The correlation coefficient is 0.9997. Allan variance analysis shows that the minimum detection limit of the experimental system can reach 1.2×10⁻⁸. This study shows that calibration-free wavelength modulation spectroscopy can avoid the interference of light intensity jitter, air flow and system vibration. The system stability and detection sensitivity are improved.
  • 加载中
  • [1]

    HANSON R K. Applications of quantitative laser sensors to kinetics, propulsion and practical energy systems[J]. Proceedings of the Combustion Institute, 2011, 33(1): 1-40. doi: 10.1016/j.proci.2010.09.007
    [2]

    CAI T D, GAO G Zh, WANG R M, et al. Measurements of CO2 concentration at high temperature and pressure environments using tunable diode laser absorption spectroscopy[J]. Spectroscopy and Spectral Analysis, 2014, 34(7): 1769-1773 (in Chinese).
    [3]

    LI Ch L, WU Y F, QIU X B, et al. Pressure-dependent detection of CO employing wavelength modulation spectroscopy using a Herriott-type cell[J]. Applied Spectroscopy, 2017, 71(5): 809-816. doi: 10.1177/0003702816682194
    [4]

    BIELECKI Z, STACEWICZ T, WOJTAS J, et al. Selected optoelectronic sensors in medical applications[J]. Opto-Electronics Review, 2018, 26(2): 122-133. doi: 10.1016/j.opelre.2018.02.007
    [5]

    ZHANG X, CAO Sh Y, GUO T X, et al. Research of methane volume fraction field reconstruction based on tunable diode laser absorption spectroscopy detection technology[J]. Laser Technology, 2018, 42(4): 577-582(in Chinese).
    [6]

    LI Ch L, SHAO L G, MENG H Y, et al. High-speed multi-pass tunable diode laser absorption spectrometer based on frequency-modulation spectroscopy[J]. Optics Express, 2018, 26(22): 29330-29339. doi: 10.1364/OE.26.029330
    [7]

    LIU K, WANG L, WANG G Sh, et al. Highly sensitive detection of methane by near-infrared laser absorption spectroscopy using a compact dense-pattern multipass cell[J]. Sensors and Actuators, 2015, B220: 1000-1005.
    [8]

    POGANY A, WAGNER S, WERHAHN O, et al. Development and metrological characterization of a tunable diode laser absorption spectroscopy (TDLAS) spectrometer for simultaneous absolute measurement of carbon dioxide and water vapor[J]. Applied Spectroscopy, 2015, 69(2): 257-268. doi: 10.1366/14-07575
    [9]

    LIU J T C, JEFFRIES J B, HANSON R K. Wavelength modulation absorption spectroscopy with 2f detection using multiplexed diode lasers for rapid temperature measurements in gaseous flows[J]. Applied Physics, 2004, B78(3): 503-511.
    [10]

    LI Ch G, DONG L, ZHENG Ch T, et al. Compact TDLAS based optical sensor for ppb-level ethane detection by use of a 3.34μm room-temperature CW interband cascade laser[J]. Sensors and Actuators, 2016, B232: 188-194.
    [11]

    LI H, RIEKER G B, LIU X, et al. Extension of wavelength-modulation spectroscopy to large modulation depth for diode laser absorption measurements in high-pressure gases[J]. Applied Optics, 2006, 45(5): 1052-1061. doi: 10.1364/AO.45.001052
    [12]

    KLUCZYNSKI P, GUSTAFSSON J, LINDBERG Å M, et al. Wavelength modulation absorption spectrometry-an extensive scrutiny of the generation of signals[J]. Spectrochimica Acta, 2001, B56(8): 1277-1354.
    [13]

    LI N, WENG Ch Sh. Calibration-free wavelength modulation absorption spectrum of gas[J]. Acta Physica Sinica, 2011, 60(7): 070701 (in Chinese).
    [14]

    PENG Zh M, DING Y J, CHE L, et al. Calibration-free wavelength modulated TDLAS under high absorbance conditions[J]. Optics Express, 2011, 19(23): 23104-23110. doi: 10.1364/OE.19.023104
    [15]

    SUR R, SUN K, JEFFRIES J B. Multi-species laser absorption sensors for in situ monitoring of syngas composition[J]. Applied Physics, 2014, B115(1): 9-24.
    [16]

    HE Y, ZHANG Y J, KAN R F, et al. Study on laser sensing technology for multipoint mash gas in coal mine[J]. Optical Technique, 2008, 34(s1): 193-195 (in Chinese).
    [17]

    XIA H, LIU W Q, ZHANG Y J, et al. System design of open-path natural gas leakage detection based on Fresnel lens[J]. Spectroscopy and Spectral Analysis, 2009, 29(3): 844-847 (in Chinese).
    [18]

    FAROOQ A, JEFFRIES J B, HANSON R K. Sensitive detection of temperature behind reflected shock waves using wavelength modulation spectroscopy of CO2 near 2.7μm[J]. Applied Physics, 2009, B96(1): 161-173.
    [19]

    HERRIOTT D, KOGELNIK H, KOMPFNER R. Off-axis paths in spherical mirror interferometers[J]. Applied Optics, 1964, 3(4): 523-526. doi: 10.1364/AO.3.000523
    [20]

    SILVER J A, STANTON A C. Optical interference fringe reduction in laser absorption experiments[J]. Applied Optics, 1988, 27(10): 1914-1916. doi: 10.1364/AO.27.001914
    [21]

    ROTHMAN L S, GORDON I E, BARBE A, et al. The HITRAN 2008 molecular spectroscopic database[J]. Journal of Quantitative Spectroscopy and Radiative Transfer, 2009, 110(9/10): 533-572.
    [22]

    LI Ch L, SHAO L G, JIANG L J, et al. Simultaneous measurements of CO and CO2 employing wavelength modulation spectroscopy using a signal averaging technique at 1.578μm[J]. Applied Spectroscopy, 72(9): 1380-1398.
  • 加载中
通讯作者: 陈斌, bchen63@163.com
  • 1. 

    沈阳化工大学材料科学与工程学院 沈阳 110142

  1. 本站搜索
  2. 百度学术搜索
  3. 万方数据库搜索
  4. CNKI搜索

Figures(8)

Article views(6344) PDF downloads(44) Cited by()

Proportional views

Multipass absorption spectroscopy based on calibration- free wavelength modulation

    Corresponding author: LI Chuanliang, clli@tyust.edu.cn
  • College of Applied Science, Taiyuan University of Science and Technology, Taiyuan 030024, China

Abstract: In order to study the immunity of calibration-free wavelength modulation spectroscopy to laser intensity change and external interference, multi-path absorption spectra based on calibration-free wavelength modulation technology were adopted. Taking acetylene as the measurement target, theoretical analysis and experimental verification were carried out. The results show that, the amplitude of wavelength modulated second harmonic signal varies significantly under different laser power. But the signal obtained by the calibration-free method changes little. It is less affected by external disturbance such as airflow, partial shading and system vibration. The spectral signals with volume fraction in the range of 5×10⁻⁶ ~9×10⁻⁵ obtained by calibration-free method have good linearity. The correlation coefficient is 0.9997. Allan variance analysis shows that the minimum detection limit of the experimental system can reach 1.2×10⁻⁸. This study shows that calibration-free wavelength modulation spectroscopy can avoid the interference of light intensity jitter, air flow and system vibration. The system stability and detection sensitivity are improved.

引言
  • 随着激光光谱技术的发展,可调谐半导体激光吸收光谱(tunable diode laser absorption spectroscopy, TDLAS)技术被广泛应用于工业过程控制、环境监测以及生物医学等领域的痕量气体定量检测分析[1-5]。但传统的单光程直接吸收TDLAS技术灵敏度低,不能满足实际应用中的要求,因此近年来多光程吸收池以及波长调制光谱(wavelength modulation spectroscopy, WMS)等技术被应用于TDLAS中来提高系统的探测灵敏度[6-8]。波长调制技术是在激光器扫描信号上叠加高频正弦波调制信号,通过相敏检波实现对微弱信号的放大,通常认为解调得到的二次谐波信号幅值与待测气体体积分数成线性关系[9-10]。然而波长调制光谱和直接吸收光谱均易受激光光强变化以及检测系统增益等的影响[11-14]。LI等人提出在波长调制光谱技术的基础上,利用剩余幅度调制,用一次谐波(1f)信号对二次谐波(2f)信号进行归一化(2f/1f),来消除激光光强变化等的影响,从而避免对系统重复校准的工作[11]。SUR等人也采用该方法设计了多组分激光吸收传感器实现高温高压下CO, CO2, CH4和H2O的同时探测[15]。HE等人将TDLAS技术和光纤传感技术结合,研制了光纤分布式多点瓦斯监测系统,并采用2f/1f技术减小光强的干扰[16]。XIA等人同样也对探测光强变化对体积分数的影响进行了研究,并通过归一化光强的方法进行消除[17]

    本文中针对2f/1f免校准波长调制技术,首先从理论上验证了该方法的可行性,然后实验通过改变激光器工作温度及注入电流来改变出光功率,从而研究2f信号随光强的变化,进一步研究验证了免校准技术对激光功率变化以及外界气流、部分遮光、系统震动等干扰的免疫能力,并采用基于免校准波长调制的多光程吸收光谱对通信波段1.5μm附近的C2H2进行了测量。

1.   免校准波长调制理论
  • 在波长调制光谱中,激光通过样品吸收池后的透射光光强It与入射光光强I0遵循Beer-Lambert定律并展开为傅里叶余弦级数:

    式中, τ(ν)称为透射率,N为每立方厘米待测气体分子个数,σ(ν)为吸收横截面,ν为中心波数,p为吸收池内压强,S(T)为对应温度T下单位压强的谱线吸收强度,L为有效光程,χ为待测分子体积分数,φ(ν)为吸收谱线线型函数,Ak可表示为:

    当叠加上频率为ω的调制信号时,I0可表示为:

    式中, I0为平均光强,i1ψ1分别为线性强度调制幅值与相位移动,i2ψ2分别为非线性强度调制幅值与相位移动。将(3)式代入(1)式中进行谐波探测,可得1f信号S1f与2f信号S2f在吸收线型中心的表达式为[11, 15, 18]

    式中,G为系统光电增益。

    从(4)式中可以发现,波长调制2f与1f信号均会受到系统增益系数G和光强I0的影响,通过在吸收线中心使用1f信号对2f信号进行归一化,可以有效避免系统增益及光强对测量信号的影响,归一化后的信号S2f/1f可表示为:

2.   实验系统搭建
  • 基于上述理论,搭建了一套结合多光程吸收池的免校准波长调制光谱系统,并选取通信波段1.5μm附近的C2H2分子吸收谱线进行实验验证。系统原理图如图 1所示,光源采用中心频率为1.514μm的分布反馈式(distribute feedback,DFB)激光器,并由半导体激光控制器(ILX Lightwave,LDC-3724C)来控制激光器的工作温度及注入电流,由锁相放大器(Stanford Research System,SR830)产生的正弦波调制信号及数据采集卡(data acquisition, DAQ)产生三角波扫描信号经加法器叠加后连接到激光控制器,来实现激光器频率上的扫描及调制。激光器辐射出的激光先经过光学隔离器以避免反射光对激光器正常工作产生影响甚至损坏,之后由光纤分束器分为3束,其中一束连接到波长计(Bristol Instruments,Model 621B)来监控激光器输出波长,另一束经过Fabry-Perot标准具来监测扫描波长线性度,自由光谱区为0.014cm-1。最后一束经由渐变折射率(graded index, GRIN)透镜后准直为平行空间光束,然后进入多光程吸收池。由于Herriott型多光程池相比于其它多光程池存在诸多优势[19-20],例如结构简单、易调节、存在干涉的可能性相对较小等,因此本系统采用有效光程为55m的Herriott型多光程吸收池。探测光束经过吸收池后由耦合反射镜反射并由透镜聚焦到探测器上转化为电信号,之后由两个锁相放大器同时解调为1f和2f信号并由数据采集卡采集传送到PC端进行处理。

    Figure 1.  Schematic diagram of calibration free WMS combined with Herriott cell

3.   实验及结果讨论
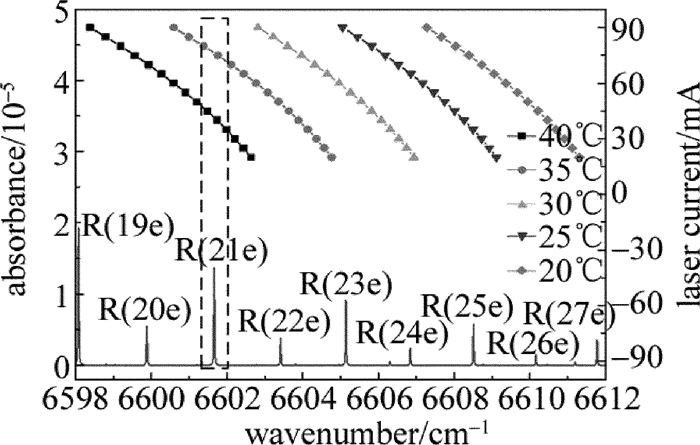
  • 作为实验验证,选取成本相对低廉的1.5μm通信波段DFB激光器作为光源,对附近有着较强吸收的C2H2分子吸收谱线进行测量。如图 2所示,测量了激光器在不同温度、电流的条件下辐射出激光的波数范围约为6598cm-1~6612cm-1,且随着电流及温度的升高,激光输出波数变小。根据HITRAN数据库[21]得到了6598cm-1~6612cm-1范围内体积分数为5×10⁻⁵的C2H2的模拟吸收谱。模拟中环境温度T设为23℃,有效光程L=1cm,由于实验系统类似于之前的工作[22],所以实验压强p采用之前工作中选择的最佳压强1.01325×10⁴Pa。实验中选择吸收较强的(10100~00000)带R(21e)吸收谱线进行测量验证。

    Figure 2.  Selection of C2H2 absorption line

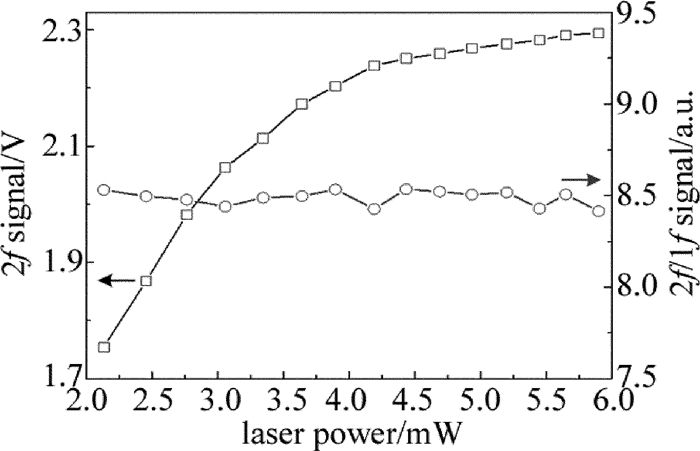
    首先测量了当激光器出光波数位于所选C2H2吸收线中心6601.66cm-1时的工作温度及注入电流,同时测量了对应的激光功率,结果如图 3所示。随着注入电流的升高,所需的工作温度降低,且激光输出功率与注入电流成正比。从图 3可以说明,选取激光器不同的工作温度及电流会影响激光输出功率,从而影响探测器光电流的大小,理论上会影响解调得到的谐波信号。因此实验测量了体积分数为5×10⁻⁵的C2H2气体在不同激光功率条件下的2f信号及2f/1f信号,结果表示在图 4中,其中2f信号幅值随着激光功率的减小而减小,图 5a图 5b中是激光功率分别为5.900mW, 3.059mW, 2.134mW时得到的2f及1f信号图。从图 4中可以看出,当采用2f/1f免校准技术时,即采用图 5所示1f信号中间值mean(1f)来归一化2f信号的最大值max(2f),从而得到归一化后的信号max(2f)/mean(1f),得到的信号值受激光功率变化的影响较小。

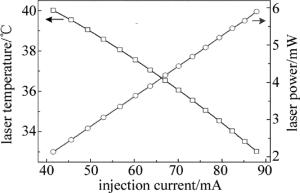
    Figure 3.  Injection currents, operating temperatures and the corresponding output power when laser output wavenumber is 6601.66cm-1

    Figure 4.  2f signals and 2f/1f signals at different laser powers

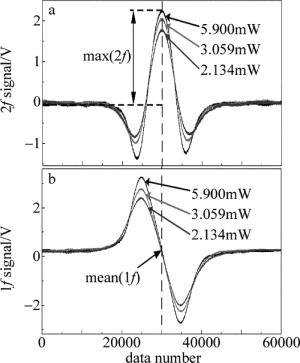
    Figure 5.  Harmonic signals when laser power is 5.900mW, 3.059mW, and 2.134mW, respectively

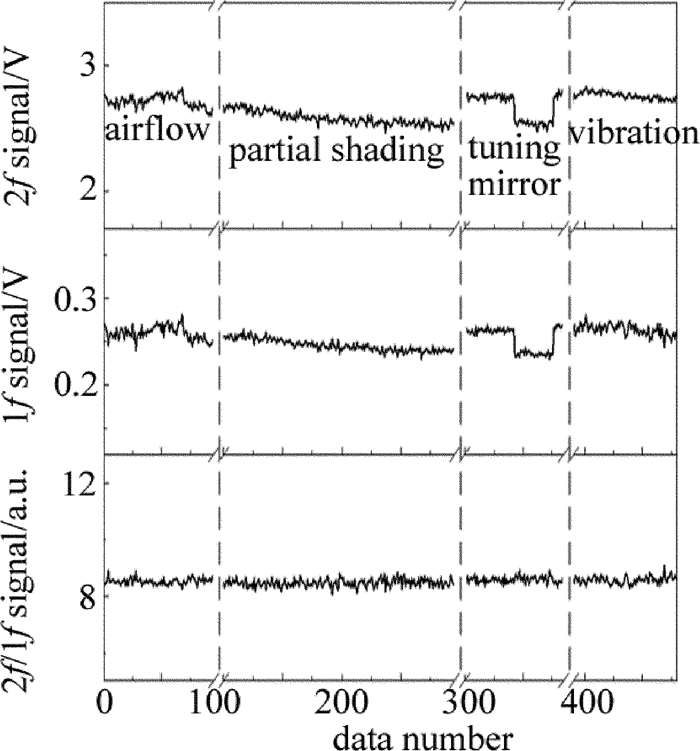
    为了进一步验证2f/1f免校准技术的可靠性及对外界干扰的免疫能力,实验中采用增加外界干扰的方法对免校准系统进行测试。分别对实验系统增加气流影响、薄纸片遮光、微调系统中的反射镜以及震动工作台4种干扰,实验结果如图 6所示。从图中可以看出,这些干扰对测量的到的2f及1f信号影响较为明显,且通过2f/1f免校准技术得到的信号受外界干扰较小,有较好的免疫能力。

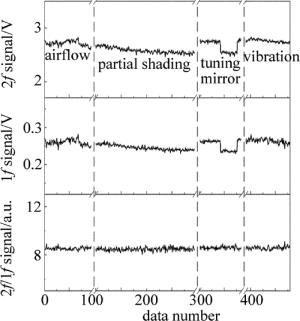
    Figure 6.  Changes of 2f, 1f and 2f/1f signals with external interference

    图 7所示,实验测量了体积分数范围为5×10⁻⁶~9×10⁻⁵的C2H2标准气体,得到了每个体积分数下的2f/1f信号,每一个体积分数均由实验测得10组数据求得平均值,测量误差通过误差棒的形式在图中表示,并通过线性拟合得到2f/1f信号与待测体积分数的线性关系图。从图中可以看出,2f/1f免校准方法得到的信号幅值与气体体积分数确实满足良好的线性关系,线性度R2可达到0.9997。

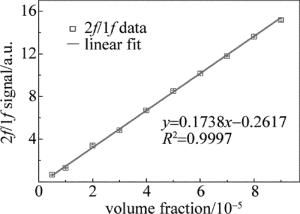
    Figure 7.  Relationship between volume fraction and experimental signals

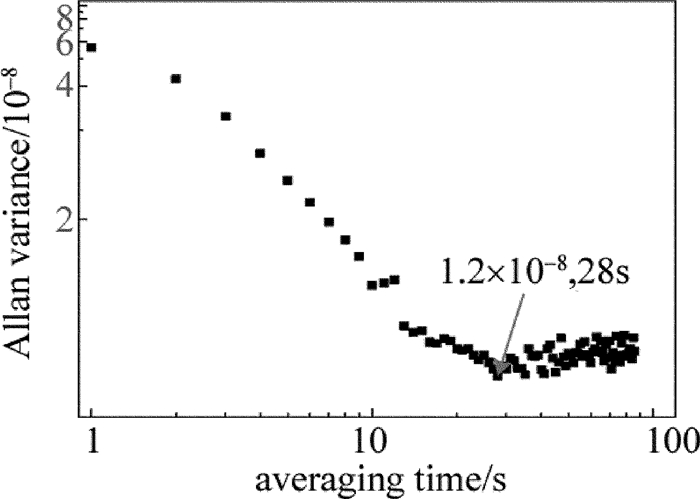
    为了得到实验系统的探测极限,衡量系统的稳定性,采用Allan方差的方法来对系统进行分析。实验中测量了1000s内的体积分数为5×10⁻⁵的C2H2气体的2f/1f信号,根据图 7中线性关系计算出相应的测量体积分数,并对其进行Allan方差分析,结果如图 8所示。从图中可以看出,该系统采用免校准技术,在1s的积分时间内可得到6×10⁻⁸的探测灵敏度,且在最佳探测时间为28s时的探测极限为1.2×10⁻⁸

    Figure 8.  Allan variance of detection system

4.   结论
  • 对2f/1f免校准波长调制技术进行了研究,首先从理论上分析得到2f信号会受到系统增益G和光强I0的影响,同时2f/1f的方法能免疫这种影响。然后在实验中选择6601.66cm-1位置的C2H2 R(21e)吸收线进行验证,实验结果表明,2f信号峰值会随着激光功率的减小而减小,而max(2f)/mean(1f)能够较好地抑制探测光功率的影响。此外还通过对免校准系统增加气流影响、部分遮光、微调反射镜以及震动,验证得出免校准方法对外界干扰具有一定的免疫能力。通过免校准方法得到的信号值与待测气体体积分数具有良好的线性关系,线性度可达0.9997,同时由Allan方差分析得到:在最佳探测时间28s时,系统的体积体积分数探测极限为1.2×10-8

Reference (22)

Catalog

    /

    DownLoad:  Full-Size Img  PowerPoint
    Return
    Return