Advanced Search

ISSN1001-3806 CN51-1125/TN Map

Volume 41 Issue 2
Mar.  2017
Article Contents
Turn off MathJax

Citation:

Dispersion measuring technique based on second order lowest power of radio frequency signal

  • Corresponding author: LUO Fengguang, fgluo@mail.hust.edu.cn
  • Received Date: 2016-03-14
    Accepted Date: 2016-04-05
  • In order to meet the need of precise compensation of chromatic dispersion in optical fiber link with long distance and high bit rate, channel dispersion measurement technique based on second order lowest power of radio frequency (RF) signal was studied and demonstrated. The chromatic dispersion in optical fiber link was measured by the phase difference between RF signals that loaded to two sidebands of spectrum. By loading RF signal on the transmitter, the periodic relationship between the power of RF signal in the receiver and optical fiber dispersion was obtained. The position of second lowest RF signal power was gotten by simulation of relationship curve between the power of RF signal in the receiver and optical fiber dispersion. The results show that, the dispersion measuring error in this system is in the range of ±10ps/nm. Comparing with the technique based on first order lowest power of RF signal, dispersion measuring technique based on second order lowest power of RF signal can satisfy the need of measuring large fiber dispersion for high chromatic dispersion value.
  • 加载中
  • [1]

    QUE L, YIN X. Analysis of dispersion tolerance in optical communication[J].Study of Optical Communications, 2008, 150(6):14-16(in Chinese).
    [2]

    CAO X. Optimization of dispersion compensation in optical fiber communication systems[J].Laser Technology, 2014, 38(1):101-104(in Chinese).
    [3]

    GLENTIS G O, GEORGOULAKIS K, ANGELOPOULOS K. Dispersion compensation of fiber links using pruned volterra equalizers[C]//Advanced Photonics 2015 OSA Technical Digest.New York, USA: Optical Society of America, 2015: JM3A.7.
    [4]

    ZHOU Zh Q, TANG Y L, XIE Ch J. Optimum schemes of dispersion compensation transmission systems using dispersion compensation fibers[J].Laser Technology, 2000, 24(5):265-269(in Chinese).
    [5]

    KAWAKAMI H, YOSHIDA E, HUBOTA H, et al. Novel signedchromatic dispersion monitoring technique based on asymmetric waveform distortion in DQPSK receiver[C]//Conference on Opto-electronics & Communications. New York, USA: IEEE, 2008: 1-2.
    [6]

    LI B, LUO F G, ZHOU W, et al. Chromatic dispersion measurement using single sideband spectrum phase difference detection for OOK signal link[J].Optics Express, 2011, 19(25):25583-25592. doi: 10.1364/OE.19.025583
    [7]

    LI B, LUO F G, TIAN M, et al. Fiber chromatic dispersion measurement by using a novel RF spectrum phase detection based on DSP[J].Optics Communications, 2012, 285(15):3249-3253. doi: 10.1016/j.optcom.2012.02.085
    [8]

    WESTBROOK P S, EGGLETON B J, RAYBON G, et al. Measurement of residual chromatic dispersion of a 40-Gb/s RZ signal via spectral broadening[J].IEEE Photonics Technology Letters, 2002, 14(3):346-348. doi: 10.1109/68.986808
    [9]

    VO T D, PELUSI M D, SCHRODER J, et al. Simultaneous multi-impairment monitoring of 640Gb/s signals using photonic chip based RF spectrum analyzer[J].Optics Express, 2010, 18(4):3938-3945. doi: 10.1364/OE.18.003938
    [10]

    SORIANO R A, HAUSKE F N, GONZALEZ N G, et al. Chromatic dispersion estimation in digital coherent receiver[J].Journal of Lightwave Technology, 2011, 29(11):1627-1637. doi: 10.1109/JLT.2011.2145357
    [11]

    YAO S, ERIKSSON T A, FU S, et al. Fast and robust chromatic dispersion estimation based on temporal auto-correlation after digital spectrum superposition[J].Optics Express, 2015, 23(12):15418-15430. doi: 10.1364/OE.23.015418
    [12]

    WANG D, LU C, LAU A P T. Adaptive chromatic dispersion compensation for coherent communication systems using delay-tap sampling technique[J].Photonics Technology Letters, 2011, 23(14):1016-1018. doi: 10.1109/LPT.2011.2151280
    [13]

    WANG Y, HU S, YAN L, et al. Chromatic dispersion and polarization mode dispersion monitoring for multi-level intensity and phase modulation systems[J].Optics Express, 2007, 15(21):14038-14043. doi: 10.1364/OE.15.014038
    [14]

    YU C, YANG J. CD and PMD monitoring based on RF spectrum analysis with optical filtering[C]//Communications and Photonics Conference and Exhibition (ACP), 2010 Asia.New York, USA: IEEE, 2010: 419-420.
    [15]

    RIBEIRO V, COSTA L, TEIXEIRA A, et al. Chromatic-dispersion-monitoring scheme using a Mach-Zehnder interferometer and Q-factor calculation[J].Journal of Optical Communications and Networking, 2010, 2(1):10-19.
    [16]

    HE F L, LIU M, DONG Ch P, et al. Research of dispersion characteristics of square-lattice all solid photonic bandgap fibers[J].Laser Technology, 2012, 36(1):90-92(in Chinese).
    [17]

    LI B. Investigation of dispersion monitoring technology for ultra-high speed optical transmission link[D].Wuhan: Huazhong University of Science and Technology, 2012: 1-116(in Chinese).
  • 加载中
通讯作者: 陈斌, bchen63@163.com
  • 1. 

    沈阳化工大学材料科学与工程学院 沈阳 110142

  1. 本站搜索
  2. 百度学术搜索
  3. 万方数据库搜索
  4. CNKI搜索

Figures(7) / Tables(2)

Article views(4407) PDF downloads(333) Cited by()

Proportional views

Dispersion measuring technique based on second order lowest power of radio frequency signal

    Corresponding author: LUO Fengguang, fgluo@mail.hust.edu.cn
  • School of Optical and Electronic Information, Huazhong University of Science and Technology, Wuhan 430074, China

Abstract: In order to meet the need of precise compensation of chromatic dispersion in optical fiber link with long distance and high bit rate, channel dispersion measurement technique based on second order lowest power of radio frequency (RF) signal was studied and demonstrated. The chromatic dispersion in optical fiber link was measured by the phase difference between RF signals that loaded to two sidebands of spectrum. By loading RF signal on the transmitter, the periodic relationship between the power of RF signal in the receiver and optical fiber dispersion was obtained. The position of second lowest RF signal power was gotten by simulation of relationship curve between the power of RF signal in the receiver and optical fiber dispersion. The results show that, the dispersion measuring error in this system is in the range of ±10ps/nm. Comparing with the technique based on first order lowest power of RF signal, dispersion measuring technique based on second order lowest power of RF signal can satisfy the need of measuring large fiber dispersion for high chromatic dispersion value.

引言
  • 信息社会的发展, 特别是物联网概念的构想对信号的传输速率与传输距离提出了更高的要求, 相应信道内的模内色散对信道内传输信号的影响进一步增大。在非归零码(non-return to zero, NRZ)传输格式下, 10Gbit/s传输速率的光信号在1550nm信道内的容忍色散为1250ps/nm, 40Gbit/s传输速率信号的容忍色散为65ps/nm, 而100Gbit/s信号则进一步减小到10ps/nm[1]。因此, 为了实现高速信号在长距离光纤信道中的传播, 需要精确测量信道内的色散, 以便实现进一步的色散补偿[2-4]

    目前国内外已经提出了多种技术方法来实现信道内色散的测量[5-16]。信道内色散测量的一般思路为探测与链路色散相关的物理量, 然后计算提取信道的色散信息。其中, 基于畸变非对称波阵面的色散测量技术已经被研究分析[5], 该方案无需在发射端增加导频信号, 但需要复杂的时钟恢复系统与高速位相比较器, 增加了系统的复杂度以及设备成本。分析信号的频谱可以得到信道内的色散信息, 如基于单边带频谱相位差探测的色散测量技术[6]和基于双边带频谱相位差探测的色散测量技术[7], 可实现光纤信道色散的在线实时测量, 但只适用于幅度调制的传输系统中; 另外, 可利用光纤内的自相位效应和交叉相位效应来探测链路内的色散[8-9], 但该类测量方式与信号的调制格式以及速率相关。采用电域[10-12]即基于数字信号处理(digital signal processing, DSP)的数字信号自相关频谱分析的色散测量方法可以利用成熟的DSP技术, 设备成本较低, 只是该算法的测量误差较大。

    本文中采用的基于射频(radio frequency, RF)2阶零功率点的信道色散测量技术可实现高速率、大色散光纤链路系统内色散的测量, 色散测量误差可控制在±10ps/nm范围内。并且该技术需要的系统复杂度低、设备成本低, 能够满足大部分工程实际应用的需求, 预期可得到广泛应用。

1.   工作原理
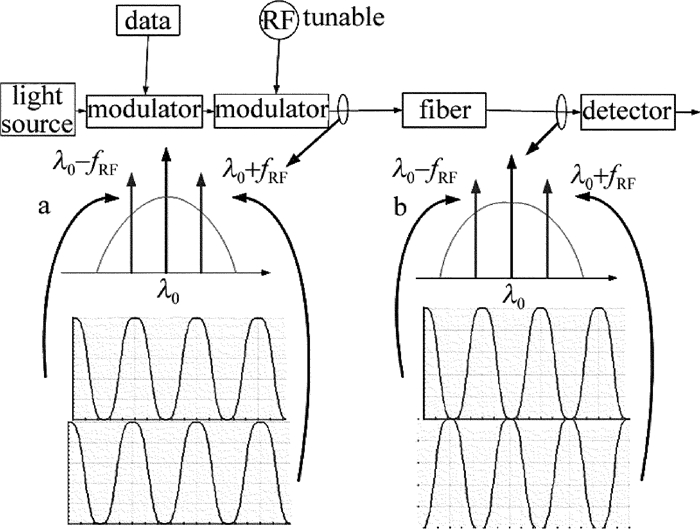
  • 图 1所示为基于射频信号2阶零功率点的信道色散测量工作原理图, 射频信号频率为fRF。由色散产生机制可知, 光纤链路中的色散效应影响信号频谱的相位, 并且调制光信号频谱上下双边带受到的作用不同。如图 1a所示, 入射端信号(中心频率为λ0)频谱两边带的位相相同, 则边带频率λ0-fRF与频率λ0+fRF处幅度相同; 经过光纤链路色散效应以后, 如图 1b所示, 接收端信号频谱两边带的位相存在一个位相差ΔφRF。当ΔφRF=(2m+1)π(m=0, 1, 2, 3, …)时, 两边带频率λ0-fRFλ0+fRF处的幅度恰好相反, 此时接收端探测到的射频信号功率理论值为零, 即射频信号的零功率点。因此, 可以通过提取探测后射频信号功率谱来实现光纤链路中色散的测量。探测得到的射频信号功率与光纤链路色散的关系式如下所示[17]:

    Figure 1.  Measurement principle of fiber dispersion based on second order lowest power of RF signal

    式中, P(fRF)为探测到的射频的电信号功率, P0为零色散条件下探测到的射频信号峰值功率, k为调制深度, fRF表示入射端加载的射频信号频率大小, λ为光载波波长, c为光速, D为光纤链路累积色散。

    分析(1)式可知, 当信号两边带位相差$\Delta {\varphi _{{\rm{RF}}}} = \frac{{{\rm{ \mathsf{ π} }}{f_{{\rm{RF}}}}^2\lambda }}{c} \times D = \left( {2m + 1} \right){\rm{ \mathsf{ π} }}$保持不变, 接收端射频信号功率达到零功率点, 有:

    即零功率点处链路色散值与射频信号频率的平方成反比例关系, 其中ΔφRF=π为射频信号的1阶零功率点; ΔφRF=3π为射频信号的2阶零功率点。在信号发送端加载可调谐的射频信号, 由于包括被测量光纤链路中色散在内的其它量基本恒定, 因此信号接收端测得的射频信号功率随频率fRF的变化曲线可以获得, 从而可以从曲线的零功率点(仿真实验中的极小值点)来获取光纤链路上的色散信息。

2.   不同射频信号频率下信道色散的测量
  • 基于射频信号2阶零功率点的信道色散测量系统如图 2所示。发射端级联的马赫-曾德尔调制器(Mach-Zehnder modulator, M-ZM)把射频信号加载到待测光纤链路中; 然后, 接收端的滤波器滤出射频信号并传输到功率计中进行功率测量。在OPTISYSTEM系统软件中, 搭建了如图 2所示的仿真实验系统。为了在不同射频信号频率下获取接收端射频信号功率随信道色散的变化曲线, 具体仿真数据设置为:光源的中心波长为1552.123nm, 光源发射功率为0dBm, 线宽为10MHz; M-ZM的消光比设置为30dB, 系数为-1;设置3种余弦射频信号, 频率分别为10GHz, 14.14GHz和20GHz; 链路内掺铒光纤放大器(erbium-doped optical fiber amplifier, EDFA)的放大增益为15dB, 噪声系数为4dB; 单模光纤长度为2km, 色散系数从0ps·(nm·km)-1变化到1700ps·(nm·km)-1, 色散系数的扫描步长为17ps·(nm·km)-1, 扫描101次; 可调谐光滤波器的中心波长设定为1552.123nm, 插入损耗为5dB, 应对不同的射频信号, 光滤波器的3dB宽带分别设定为25GHz, 35GHz和50GHz; 光电探测器的响应宽带为40GHz, 响应度设置为0.85A/W, 暗电流为2nA; 电带通滤波器的中心频率对应于射频信号频率, 带宽为10GHz。最终在功率计中可以测量得到射频信号的功率。

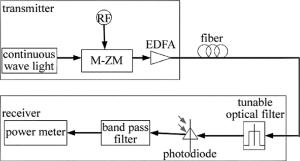
    Figure 2.  Measurement system of fiber dispersion based on second order lowest power of RF signal

    由仿真实验的数据结果, 可以得到不同射频频率下探测到的射频信号功率随光纤链路色散值的变化曲线, 如图 3所示。探测到的射频信号功率随光纤链路色散呈周期性变化, 且当链路色散引起信号上下边带相位差ΔφRF=(2m+1)π时, 接收端探测到的射频信号功率达到极小值, 这与(1)式相一致; 并且周期性大小与加载的射频频率大小有关, 即射频频率越大, 探测到的射频信号功率的变化周期越小。

    Figure 3.  The detected power of RF signal vs. dispersion value of optical fiber link under different RF fRF

    3种不同射频频率对应的1阶零功率点和2阶零功率点的色散值如表 1所示。

    fRF/GHz first order/(ps·nm-1) second order/(ps·nm-1)
    10 621 1863
    14.14 311 934
    20 153 460

    Table 1.  Dispersion value of first order and second order lowest power under different RF fRF

    当射频频率为10GHz时, 1阶零功率点对应的色散值为621ps/nm, 2阶零功率点对应的色散值则为1863ps/nm。

    由(2)式可以得到链路色散值D与1阶零功率点处频率值之间的关系式为:

    链路色散值与2阶零功率点处频率值之间的关系式为:

    由14.14GHz以及20GHz频率射频信号的色散值验证可知, (3)式和(4)式可用于求取光纤链路中的色散信息。光纤链路中的色散值随零功率点色散值的变化曲线如图 4所示。

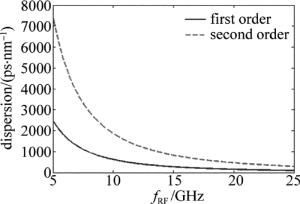
    Figure 4.  Dispersion value of optical fiber link vs. fRF under first order and second order lowest power of RF signal in the receiver

3.   实验仿真与误差分析
  • 扫描射频信号获取光纤链路色散信息的实验仿真首先确定光纤链路中2阶(或者1阶)零功率点处的频率f02(或者f01), 然后根据(4)式或(3)式来计算链路中的色散大小, 具体实验仿真系统如图 2所示。仿真数据为:光源的中心波长为1552.123nm, 光源发射功率为3dBm, 线宽为10MHz; M-ZM的消光比为30dB, 系数为-1;射频信号频率从5GHz变化到20GHz, 频率扫描步长为60MHz; 链路EDFA增益系数为30dB, 噪声系数为6dB; 单模光纤长度的色散系数为17ps·(nm·km)-1, 损耗大小为0.2dB/km, 长度设定为20km到120km, 步长为10km, 即仿真色散变化范围为340ps/nm~2040ps/nm, 色散扫描步长为170ps/nm; 可调谐光滤波器的中心波长设定为1552.123nm, 插入损耗为5dB, 3dB宽带设定为30GHz; 光电探测器的响应宽带为30GHz, 响应度设置为0.85A/W, 暗电流为2nA; 电带通滤波器的中心频率对应于射频频率, 带宽为4GHz。

    当光纤内模内色散值等于340ps/nm时, 由图 4可以大致估算出1阶零功率点所在射频频率位置, 即实验中导频频率的具体扫描范围可以设置为13.6GHz~16.6GHz; 2阶零功率点所在射频信号频率则大于20GHz, 不在扫描范围内。具体实验结果如图 5所示, 则可以求出1阶零功率点f01≈13.52GHz。

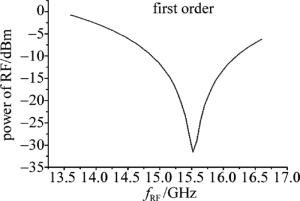
    Figure 5.  Power of RF signal vs. fRF under D=340ps/nm

    当单模光纤内模内色散值为510ps/nm时, 由图 4可以大致估算出射频信号1阶和2阶零功率点所在射频频率位置, 即实验中射频频率的具体扫描范围可以设置为9GHz~12GHz和17GHz~20GHz。实验仿真结果如图 6a图 6b所示, 则可求出f01≈11.04GHz和f02≈19.16GHz。

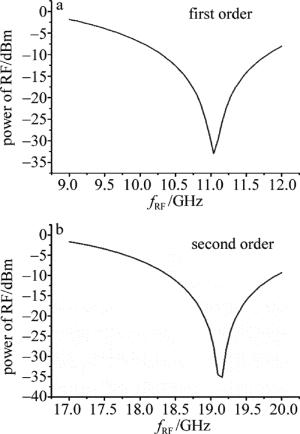
    Figure 6.  Power of RF signal vs.fRF under D=510ps/nm

    同理, 可测得不同链路色散下射频信号1阶零功率点对应的射频频率f01和2阶零功率点对应的f02, 并可根据(3)式和(4)式估算出光纤链路中的色散, 如表 2所示。

    actual value/(ps·nm-1) f01/GHz calculated value by equation (3)/(ps·nm-1) f02/GHz calculated value by equation (4)/(ps·nm-1)
    340 15.52 339.73 > 20
    510 11.04 509.51 19.16 507.48
    680 9.56 679.48 16.56 677.71
    850 8.54 851.48 14.84 845.95
    1020 7.8 1020.70 13.5 1022.22
    1190 7.22 1191.29 12.5 1192.32
    1360 6.74 1367.01 11.72 1356.30
    1530 6.36 1535.24 11.06 1523.01
    1700 6.02 1713.56 10.46 1702.74
    1870 5.78 1858.81 9.98 1870.47
    2040 5.54 2023.35 9.58 2029.93

    Table 2.  Comparing of the calculated fiber dispersion vs. the actual fiber dispersion
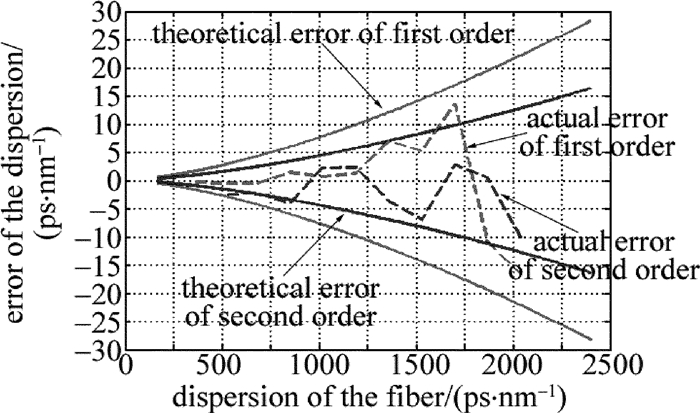
    表 2中数据, 可以得到射频信号1阶零功率点和2阶零功率点测得色散值误差随链路中实际色散的变化曲线, 如图 7中虚线所示。当链路实际色散较小时, 1阶零功率点和2阶零功率点测得色散值误差都可以控制在±1ps/nm误差要求内; 但当链路色散较大(1500ps/nm~2000ps/nm)时, 2阶零功率点测得色散误差在±10ps/nm误差范围内, 1阶零功率点测得色散误差则大于±10ps/nm。

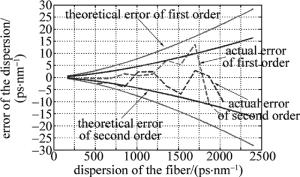
    Figure 7.  Errors of dispersion measurement including the actual errors by simulation and the largest theoretical errors

    经分析可知, 当链路色散较大时, 由射频频率扫描步长引起的色散误差为测量的主要误差。由(3)式和(4)式可知, 由射频频率扫描步长引起的最大可能色散误差为$\Delta D = \frac{{200}}{{{f_{01}}^3 \times 621}} \times \Delta {f_1} = - \frac{{200}}{{{f_{02}}^3}} \times 1863 \times \Delta {f_2}$, 其中Δf1f2等于1/2扫描步长, 即±30MHz。则扫描步长引起的最大可能色散误差如图 7中实线所示。由图可知, 当测量误差等于±10ps/nm, 2阶零功率点对应可测得的色散值为1750ps/nm, 远大于1阶零功率点的1250ps/nm。因此, 相较于1阶, 2阶零功率点精确测量大色散系统内的色散信息, 以满足高速率信号的传输。

4.   结论
  • 提出了基于射频信号2阶零功率点的信道色散测量技术方案, 对其基本原理进行了分析。该方案采用信号两边带的位相差来测量光纤链路中的色散值, 通过在发射端加载射频信号, 可以得到接收端射频信号功率大小随链路色散值的周期性变化关系, 从而仿真获得接收端射频信号2阶零功率点位置光纤链路色散随射频信号频率的变化曲线。通过仿真实验发现, 链路色散很小时, 射频信号1阶零功率点和2阶零功率点两种方式测得的色散值与实际色散值的误差较小, 可控制在1ps/nm范围内; 但当链路色散较大时, 2阶零功率点方案能够实现1750ps/nm色散的精确测量, 远大于2阶零功率点的1250ps/nm。因此基于射频信号2阶零功率点的信道色散测量技术更适用于精确测量大色散系统内的色散信息, 以实现高速率信号在系统内的传输和接收。

Reference (17)

Catalog

    /

    DownLoad:  Full-Size Img  PowerPoint
    Return
    Return