Advanced Search

ISSN1001-3806 CN51-1125/TN Map

Volume 42 Issue 4
May  2018
Article Contents
Turn off MathJax

Citation:

Analysis of magneto-optical imaging characteristics of weld defects under magnetic field excitation

  • Corresponding author: GAO Xiangdong, gaoxd666@126.com
  • Received Date: 2017-09-20
    Accepted Date: 2017-11-21
  • In order to study the characteristics of magnetic-optical images of weld defects excited by magnetic field, low carbon steel of laser welding was used as test object and the welding defects were excited by constant magnetic field and 50Hz alternating magnetic field. Real-time magnetic field distribution of welding defect area was obtained by magnetic-optical imaging sensor. Through theoretical analysis and experimental verification, the magneto-optic images of welding defects of low carbon steel (Q235) of thickness of 1mm, 2mm and 3mm with constant magnetic field and alternating magnetic field were obtained, and then, were compared with COMSOL simulation results. The weighted average image fusion technique was used to fuse the magnetic-optical images of welding defects in the alternating magnetic field. The results show that, compared with the excitation of constant magnetic field, the welding defect information obtained by the alternating excitation is more accurate, fast and complete, and avoids the omission of welding defect information effectively. This study provides the basis for improving the detection efficiency of welding defects.
  • 加载中
  • [1]

    ZHANG Y L, ZHANG H Ch, ZHAO J X, et al. Review of non-destructive testing for remanufacturing of high end equipment[J]. Journal of Mechanical Engineering, 2013, 53(7):80-90(in Chinese).
    [2]

    KOSCHNY M, LINDNER M. Magneto-optical sensors accurately analyze magnetic field distribution of magnetic materials[J]. Advanced Materials & Processes, 2012, 170(2):13-16.
    [3]

    GAO X D, CHEN Y Q, YOU D Y, et al. Detection of micro gap weld joint by using magneto-optical imaging and Kalman filtering compensated with RBF neural network[J]. Mechanical Systems & Signal Processing, 2017, 84:570-583.
    [4]

    GAO X D, WU J J. Approach of detecting and tracking micro weld joint based on magneto optical imaging[J]. Journal of Mechanical Engineering, 2015, 51(4):71-77(in Chinese). doi: 10.3901/JME.2015.04.071
    [5]

    HU X Ch, LUO F L, HE B Z, et al. Pulsed alternating current field measurement technique for defect identification and quantification[J]. Journal of Mechanical Engineering, 2011, 47(4):17-22(in Chinese). doi: 10.3901/JME.2011.04.017
    [6]

    GAO X D, LAN Ch Zh, YOU D Y, et al. Weldment nondestructive testing using magneto-optical imaging induced by alternating magnetic field[J]. Journal of Nondestructive Evaluation, 2017, 36(3):55. doi: 10.1007/s10921-017-0434-4
    [7]

    DENG Y, LIU X, UDPA L. Magneto-optic imaging for aircraft skins inspection:a probability of detection study of simulated and experimental image data[J]. IEEE Transactions on Reliability, 2011, 61(4):1-8.
    [8]

    RICHERT H, SCHMIDT H, LINDNER S, et al. Dynamic magneto-optical imaging of domains in grain oriented electrical steel[J]. Steel Research, 2016, 87(2):232-240. doi: 10.1002/srin.v87.2
    [9]

    GAO X D, LI G H, XIAO Zh L, et al. Detection and classification of welded defects by magneto-optical imaging based on multi-scale wavelet[J]. Optics and Precision Engineering, 2016, 24(4):930-936(in Chinese). doi: 10.3788/OPE.
    [10]

    CHEN Y H, ZHOU Z F, YIN B B. Study on magneto optical/eddy current imaging system for real time testing[J]. Optics and Precision Engineering, 2006, 14(5):797-801(in Chinese).
    [11]

    LE M, LEE J, SHOJI T. A simulation of magneto-optical eddy current imaging[J]. NDT & E International, 2011, 44(8):783-788.
    [12]

    GAO X D, HUANG G X, XIAO Zh L, et al. Micro weld detection based on magneto-optical imaging and wavelet multi-scale fusion[J]. Transactions of the China Welding Institution, 2016, 37(4):1-4(in Chinese).
    [13]

    HAGHIGHAT M B A, AGHAGOLZADEH A, SEYEDARABI H. Multi-focus image fusion for visual sensor networks in DCT domain[J]. Computers & Electrical Engineering, 2011, 37(5):789-797.
    [14]

    PRAKASH O, KUMAR A, KHARE A. Pixel-level image fusion scheme based on steerable pyramid wavelet transform using absolute maximum selection fusion rule[C]//International Conference on Issues and Challenges in Intelligent Computing Techniques. New York, USA: IEEE, 2014: 765-770.
    [15]

    ZHENG W, SUN X Q, LI Zh. Image fusion based on Shearlet transform and region characteristics[J]. Laser Technology, 2015, 39(1):50-56(in Chinese).
    [16]

    LI H H, GUO L, LIU H. Research on image fusion based on the second generation curvelet transform[J]. Acta Photonica Sinica, 2006, 26(5):657-662(in Chinese).
    [17]

    GAO Y, WANG A M, WANG F H, et al. Application of improved wavelet transform algorithm in image fusion[J]. Laser Technology, 2013, 37(5):690-695(in Chinese).
    [18]

    ZHU P, LIU Z Y, HUANG Zh H. Infrared polarization and intensity image fusion based on dual-tree complex wavelet transform and sparse representation[J/OL].(2017-05-08)[2017-11-07].http://kns.cnki.net/kcms/detail/61.1235.O4.20170508.1426.116.html (in Chinese).
  • 加载中
通讯作者: 陈斌, bchen63@163.com
  • 1. 

    沈阳化工大学材料科学与工程学院 沈阳 110142

  1. 本站搜索
  2. 百度学术搜索
  3. 万方数据库搜索
  4. CNKI搜索

Figures(9) / Tables(2)

Article views(5723) PDF downloads(344) Cited by()

Proportional views

Analysis of magneto-optical imaging characteristics of weld defects under magnetic field excitation

    Corresponding author: GAO Xiangdong, gaoxd666@126.com
  • Guangdong Provincial Welding Engineering Technology Research Center, Guangdong University of Technology, Guangzhou 510006, China

Abstract: In order to study the characteristics of magnetic-optical images of weld defects excited by magnetic field, low carbon steel of laser welding was used as test object and the welding defects were excited by constant magnetic field and 50Hz alternating magnetic field. Real-time magnetic field distribution of welding defect area was obtained by magnetic-optical imaging sensor. Through theoretical analysis and experimental verification, the magneto-optic images of welding defects of low carbon steel (Q235) of thickness of 1mm, 2mm and 3mm with constant magnetic field and alternating magnetic field were obtained, and then, were compared with COMSOL simulation results. The weighted average image fusion technique was used to fuse the magnetic-optical images of welding defects in the alternating magnetic field. The results show that, compared with the excitation of constant magnetic field, the welding defect information obtained by the alternating excitation is more accurate, fast and complete, and avoids the omission of welding defect information effectively. This study provides the basis for improving the detection efficiency of welding defects.

引言
  • 为保证焊接产品的质量和使用安全,必须对焊缝质量进行无损检测。目前检测法主要有:目视检测法、射线检测法、超声波检测法、渗透检测法、磁粉检测法、漏磁检测法、涡流检测法及磁光成像检测法[1]。常规无损检测法对微小焊接缺陷有时会出现漏检的现象。磁光成像是基于法拉第磁光效应的新检测法,具有灵敏度高和缺陷成像等特点,可以检测微小缺陷[2]

    目前国内对焊接缺陷的磁光成像检测基本上都是基于恒定磁场励磁,应用于微间隙焊缝跟踪和无损检测,用直流U型电磁铁给被测焊缝两端励磁,获取高对比度的焊缝磁光图像[3-4]。国内目前除作者所在实验室外,少有研究交变磁场磁光成像的文献,近年来,国防科技大学的LUO团队研究了交变磁场测量(alternating current field measurement, ACFM)技术,该方法应用交变磁场激励被测试件,通过感应线圈获取试件信号[5]。然而其成像方法并非磁光成像,而是应用数字信号处理等方法重建试件磁场信息图像。作者所在实验室交变磁场励磁下焊缝的磁光成像研究也刚刚起步[6]。国外的磁光成像(magneto-optical image,MOI)检测设备比较成熟,已广泛用于Boeing, Douglas, Lockheed等商用飞机的检测中,美国空军、国家航空和宇航局等部门也开始使用该检测技术[7]。交变励磁下的磁光成像无损检测也取得了一定的研究成果[8]。恒定磁场励磁下焊缝的磁光成像无损检测存在缺陷:磁光图像易饱和、丢失焊缝信息。磁光传感器能非常灵敏的探测到磁感应强度的变化,而不同深度和不同大小的缺陷产生的漏磁场强度不同,因此需要在不同磁场强度下进行磁光成像来预防磁光图像饱和。为防止丢失焊缝信息,恒定磁场中检测焊缝需要较长时间找到适合的励磁强度。本文中研究恒定磁场和交变磁场励磁下焊缝的磁光成像检测,分析磁光图像特征,为提高焊接缺陷检测的效率提供依据。

1.   检测原理
  • 磁光成像传感器基于法拉第磁致旋光效应,将焊缝缺陷转变为光强图,实现缺陷的可视化成像。一束单色高功率光经过起偏器变为线偏振光,然后通过磁光薄膜及反射镜片,反射出来的偏振光经检偏器检偏后被互补金属氧化物半导体(complementary metal-oxide semiconductor,CMOS)成像元件接收形成光强图,其检测焊缝的工作原理如图 1所示。根据法拉第磁致旋光效应可知,线偏振光在磁场中会出现一定角度的旋转[9]。偏振光的旋转角θ与光波在介质中经过的路程d和介质中光的传播方向上的磁感应强度分量B成正比,即:

    Figure 1.  Working principle of magneto-optical imaging sensor to detect the seam

    式中, V为费尔德常数。

    不同焊缝形态经磁场励磁后,在缺陷上方产生的漏磁场不同,获得的磁光图像反应焊件上方漏磁场,通过图像处理技术可实现焊缝缺陷的可视化。磁光图像中灰度值的大小表明了缺陷上方漏磁场的强弱。采用交变磁场对焊件进行励磁,调节励磁频率和磁光成像传感器的采样频率,可以得到磁感应强度大小不同和磁极交替变化下的焊缝缺陷的磁光图像[10-11]。只要在采集到的磁光图像中存在不饱和的图像就能进行焊缝信息提取。

    磁光成像试验通过专用的软件分析试件的磁化特性,实现对采样文件(如磁光图像)进行预处理,处理之后的图像能够以多种格式进行保存。磁光传感器的技术参量是:发光二极管(light emitting diode,LED);光源波长为590nm;光学分辨率为25μm;磁光薄膜尺寸为(20mm×15mm),图像传输接口为USB 2.0,实现检测的磁场范围为0.01kA·m-1~160kA·m-1。磁光成像无损检测实验平台如图 2所示。

    Figure 2.  Experimental system of the welded defects detection

2.   恒定磁场励磁下焊缝检测
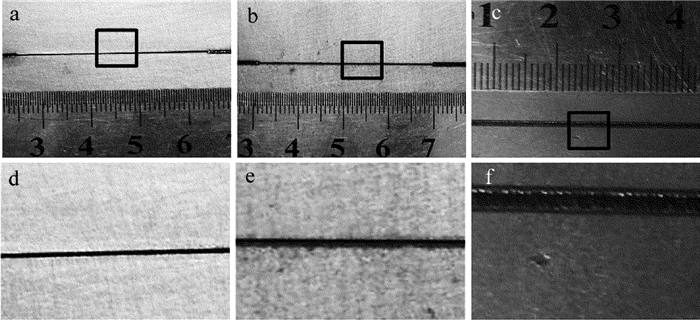
  • 实验试件为100mm×50mm(长×宽)、厚度h分别为1mm, 2mm和3mm的低碳钢(Q235)板。脉冲激光器对钢板进行对接焊,焊接功率为1kW,焊接速率为3mm/s。厚1mm和2mm钢板采用两端点焊模拟裂纹,裂纹的宽度为0.1mm和0.05mm,厚度3mm钢板的焊缝成形良好,焊缝附近的板材上存在飞溅,图 3为实物图和感兴趣区域(region of interest,ROI)放大图。磁光成像试验平台主要包括磁光传感器、电磁铁(恒定磁场或交变磁场)和工控机[12],试验条件如表 1所示。

    Figure 3.  Physical map (Fig. 3a~Fig. 3c) and ROI (Fig. 3d~Fig. 3f) of weld surface of low carbon steel plates

    weldment material weldment size(length×width×thickness)/mm excitation method excitation frequency f/Hz imaging pixels/pixel
    low-carbon steel 100×50×1(2 or 3) constant magnetic field no 400×400
    alternating magnetic field 50Hz 400×400

    Table 1.  Test conditions of magneto-optical imaging

    厚度1mm, 2mm和3mm钢板的焊缝进行恒定磁场中磁光成像无损检测试验和仿真模拟,试验结果与模拟结果进行对比。在恒定磁场中磁光成像检测试验,磁光传感器位于焊缝上方1mm处采集磁光图像。磁光图像每102pixel对应实际物体的1mm。由测量实物图可知, 厚3mm钢板的飞溅距感兴趣区域左边界0.89mm~0.99mm之间,故飞溅在磁光图像第95列~105列之间。厚度1mm和2mm钢板感兴趣区域的裂纹水平分布在整个窗口,每列灰度值Gy都可以反映磁场分布情况,故提取磁光图像第100列的灰度分布曲线,如图 4所示。

    Figure 4.  Gray-scale image of magneto-optic images and 100 columns of gray value in constant magnetic field

    图 4可知,图 4a图 4b中灰度图有明显明暗分界线,而图 4a曲线图中0pixel~200pixel, 300pixel~400pixel之间以及图 4b曲线图中70pixel~180pixel之间灰度值分布曲线呈直线分布。因为磁光薄膜存在磁滞现象,被测工件的磁感应强度超过2.5mT后,磁光薄膜会饱和,采集到的磁光图像出现过亮或过暗的现象,使灰度值分布曲线呈直线。图 4a中曲线的直线区域比图 4b大,说明图 1mm厚钢板的漏磁场比2mm的大。图 4c中曲线90pixel~100pixel间灰度值有明显突变,其余灰度值变化平缓。表明成型良好的焊缝的漏磁场均匀分布,飞溅处漏磁场分布出现明显差异。

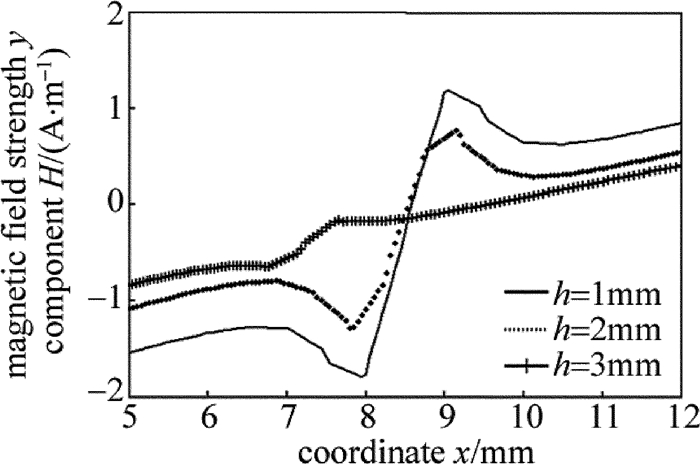
    模拟恒定磁场给焊缝励磁,由COMSOL建立与试验条件相符的模型,线圈1000匝,通入大小为2V的直流电,获得距离焊缝表面1mm处磁场强度y分量的分布曲线,如图 5所示。

    Figure 5.  y component of magnetic field strength of weld surfacein constant magnetic field

    图 5可知,模拟得到的磁场强度y分量曲线随着焊件厚度的增加,焊缝表面磁感应强度变弱,焊件越厚,表面磁场强度y分量差异越小,与图 4a图 4b的实验结果相同。磁力线由N极指向S极,N极对应的磁场强度y分量值为正值,S极对应负值,故磁场强度y分量中间会出现反转。由图 3图 4对比结果可看出,磁光成像传感器易饱和,造成磁光图像丢失焊缝信息。恒定磁场励磁检测不同厚度的钢板时,需要根据被检测钢板的厚度调节励磁源的磁场强度,获得最佳漏磁场,防止磁光图像饱和,丢失焊缝信息。

3.   交变磁场励磁下焊缝检测
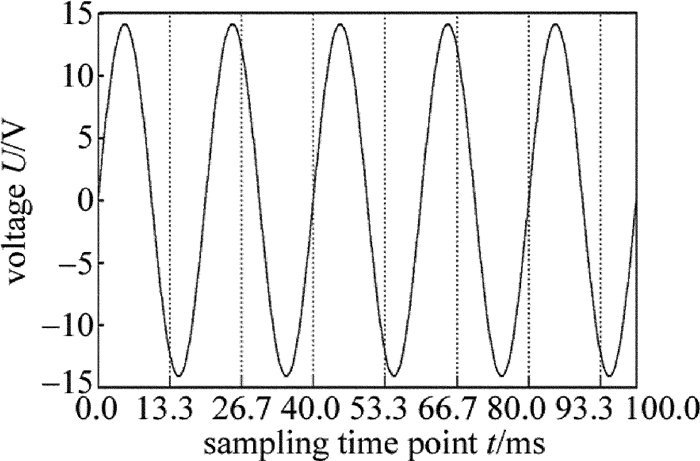
  • 厚度1mm, 2mm和3mm钢板焊缝进行交变励磁下的磁光成像无损检测试验和仿真模拟,将试验结果与模拟结果进行对比。交变励磁源的电源为有效值10V、频率50Hz正弦交流电,磁光传感器采样频率为75frame/s,如图 6所示。理想采样时间起始点t=0ms,由图 6知在励磁频率50Hz和采样频率75frame/s的条件下,获得连续3帧磁光图像是在不同磁感应强度大小和磁场方向下的焊缝图像。采样起始时间点不同,采集的磁光图像中每连续3帧图像反应的磁场方向和磁场大小均不同。进行交变磁场中磁光成像传感器焊缝检测的试验,取3个连续时间点获得距焊缝表面1mm处任意连续3帧磁光图像的灰度图如图 7所示。

    Figure 6.  Distribution map of ideal sampling points

    Figure 7.  Three consecutive frames of magneto-optical grayscale graph under alternating excitation

    分析图 7a图 7b可知,磁光成像传感器采集到的磁光图像,每帧图像的明暗交替变换,灰暗或明亮区域大小不同,对应磁感应强度的大小不同。连续3帧图像中:厚度1mm钢板的第1帧、第3帧图像饱和、第2帧较效果较好; 厚度2mm钢板的第1帧、第3帧均饱和、第2帧效果较好; 厚度3mm钢板的焊缝成形良好,磁通面积增大,磁场强度未变,未出现漏磁,磁光图像没有明显焊缝带,第2帧图像表示飞溅较模糊。COMSOL建立磁场分布测量模型,设定采样时间起始点t=0ms,采样频率75frame/s,模拟得到的磁场强度y分量曲线如图 8所示。

    Figure 8.  y component curve of the strength of the simulated magnetic field

    图 8可知,模拟得到的磁场强度y分量分布曲线可看出交变磁场中磁光成像无损检测可以获得不同磁感应强度下焊缝的磁光图像。随着焊件厚度增加,焊缝表面磁场强度y分量曲线波动范围减小,磁场强度y分量曲线中焊缝过渡带磁场变化范围较小。厚度3mm钢板焊缝成形良好,曲线过渡带没有明显突变,飞溅区域出现磁场强度y分量的差异。

    试验结果表明,交变磁场中磁光成像检测获得的一些磁光图像会出现饱和,从而出现表达焊缝信息不完整的问题。由磁光图像灰度分布图和磁场强度y分量曲线进行对比可知,连续3帧磁光图像是在不同磁极和磁感应强度下获得的。若将3幅磁光图融合成一幅图,可突出焊缝信息。

  • 图像融合是将同一对象的两个或多个图像经过图像处理和计算机技术等合成在一幅图中,新图像包含每帧原图像的特征值。同一目标的图像数据,最大限度的提取各自信道中的相关信息,最后融合成高质量的图像。图像融合分为3种,即数据融合(像素融合)、特征融合、决策融合[13-14]。随着融合技术的发展,根据不同的需求,人们提出了许多不同的图像融合算法[15-18]。特征对象较少的图像采用加权平均法融合较为方便有效,加权平均法属于像素融合,试验中应用该方法将交变电磁场中磁光传感器采集到的不同的3帧磁光图像I1, I2I3灰度化后融合为一幅图像If,融合图像可表示为:

    式中,a, b, c为每帧图像对应的权值,它们的和为1。选取了一组效果较好的权值,实验发现将a, b, c分别设置为0.26, 0.43和0.31时,融合得到的图像效果最好。将采集到的磁光图像进行加权平均法融合,如图 9所示。

    Figure 9.  Gray graphs and gray value curves after the fusion of magnetic and optical images

    图 9得到的融合后的图像与图 7中3幅磁光图像灰度图进行对比可知,图 7中厚1mm钢板的第1帧图与第3帧饱和,不利于信息提取,融合后的图像明暗适中;图 7中厚2mm钢板的3帧图像均偏暗,融合后的图像过渡带较突出;图 7中厚3mm钢板的第2帧图像没有反映飞溅,融合后的图像飞溅明显。

    图 9中灰度值曲线与图 4所示的恒定磁场励磁下焊缝检测的灰度值曲线相比,厚度1mm和2mm钢板的灰度值曲线未出现直线,灰度值曲线在图 9中的灰度值分布均比对应厚度钢板在图 4中的灰度值小。图像融合后改善了恒定磁场励磁下获得的磁光图像饱和丢失焊缝信息的现象,减少了图像饱和现象的发生机率。交变磁场励磁能够获得更加准确、可靠和全面的焊缝形态信息。图像融合技术可以提高交变励磁下获得的磁光图像的处理效率,且包含更全面的焊缝特征信息。提取图 9中灰度曲线突变点x轴像素坐标值(见x1, x2),如表 2所示。根据磁光图像像素换算比例换算成实际宽度的结果可知,由于磁光传感器在检测缺陷时提离度的影响,测得的缺陷尺寸大于其实际尺寸,且实际缺陷越大,像素差值越大。

    plate thickness h/mm defect type x1/pixel x2/pixel difference x/pixel actual width/mm
    1 0.1mm wide crack 168 209 41 0.402
    2 0.05mm wide crack 186 210 24 0.235
    3 splash 94 112 18 0.176

    Table 2.  Pixel extremum of the magneto-optical image of the welding defects

4.   结论
  • 恒定磁场励磁下,磁光成像传感器易饱和,采集到的磁光图像容易出现过亮或过暗的现象,丢失焊缝信息,故对恒定磁场的磁场强度调节要求较高。交变励磁下,当励磁频率不变时,可以获得焊缝处不同磁感应强度下的磁光图像,弥补了恒定磁场中磁光成像检测的不足,避免由于磁光传感器饱和而使磁光图像过暗或过亮和丢失重要的焊缝信息。交变励磁下获得的多幅不同磁极下焊缝位置的磁光图像,通过加权平均法融合为一幅图像,可以将多幅磁光图像获得的焊缝特征信息在一幅图上呈现出来,更加全面反映焊缝的特征信息。

Reference (18)

Catalog

    /

    DownLoad:  Full-Size Img  PowerPoint
    Return
    Return