Advanced Search

ISSN1001-3806 CN51-1125/TN Map

Volume 45 Issue 2
Mar.  2021
Article Contents
Turn off MathJax

Citation:

Numerical study on defect detection by ring light source generated ultrasonic

  • Corresponding author: ZHANG Bin, bzhang@bjtu.edu.cn
  • Received Date: 2020-04-17
    Accepted Date: 2020-06-19
  • In order to improve the generation efficiency of laser ultrasonic without damaging the measured surface, the spatial distribution of the laser source was changed, and the pulsed ring laser source was used. Using the finite element method, the numerical simulation of the full field ultrasonic wave generated in the aluminum plate was carried out by COMSOL Multiphysics. The generation characteristics of the superposition shear wave on the central axis of the ring laser source were studied, which vary with laser parameters. By simulating the change law of the ultrasonic field caused by defects, a method of detecting cracks on both sides of the ring laser source was proposed. The feasibility and effectiveness of defect detection by superposition shear wave were verified by simulating the change rule of ultrasonic field caused by defects. The results show that the generation efficiency can be significantly improved by using the ring laser source because ring light source loss is usually less than 50%. The direction of shear wave propagation is stable. The superposition depth of the shear wave is related to the ring radius, and the ring half-width can affect the intensity of the wave. The results provide a reference for the application of ring laser source generated ultrasonic in defect detection.
  • 加载中
  • [1]

    SHARPE R S, ACHENBACH J D. Research techniques in nondestructive testing[J]. Journal of Applied Mechanics, 1984, 51(2): 32-37.
    [2]

    ROYER D, CHENU C. Experimental and theoretical waveforms of Rayleigh waves generated by a thermoelasticlaser line source[J]. Ultrasonics, 2000, 38(9): 891-895. doi: 10.1016/S0041-624X(00)00022-6
    [3]

    LI W Ch, ZHANG P Zh. The research of ultrasonic testing rail defects and positioning[J]. Nuclear Electronics & Detection Technology, 2012, 32(9): 1062-1065(in Chinese).
    [4]

    WHITE R M. Generation of elastic waves by transient surface heating[J]. Journal of Applied Physics, 1963, 34(12): 3559-3561. doi: 10.1063/1.1729258
    [5]

    SCRUBY C B, DEWHURST R J, HUTCHINS D A, et al. Quantitative studies of thermally generated elastic waves in laser-irradiated metals[J]. Journal of Applied Physics, 1980, 51(12): 6210-6216. doi: 10.1063/1.327601
    [6]

    CAVUTO A, MARTARELLI M, PANDARESE G, et al. Train wheel diagnostics by laser ultrasonics[J]. Measyrement, 2016, 80(2): 99-107.
    [7]

    SONG Ch, ZHENG B, GUO H L, et al. Analysis of influence of light source on laser ultrasonic signal[J]. Journal of Applied Optics, 2017, 38(3): 494-498(in Chinese).
    [8]

    ARIAS I, ACHENBACH J D. Thermoelastic generation of ultrasound by line-focused laser irradiation[J]. International Journal of Solids and Structures, 2003, 40(25): 6917-6935. doi: 10.1016/S0020-7683(03)00345-7
    [9]

    SUN K H, SHEN Zh H, LI Y L, et al. Inspection of material internal defects using double shadow method based on laser ultrasonic reflected shear waves[J]. Chinese Journal of Lasers, 2018, 45(7): 0710001(in Chinese). doi: 10.3788/CJL201845.0710001
    [10]

    ACHENBACH J D. Quantitative nondestructive evaluation[J]. International Journal of Solids and Structures, 2000, 37(1): 13-27.
    [11]

    KROMINE A K, FOMITCHOV P A, KRISHNASWAMY S, et al. Laser ultrasonic detection of surface breaking discontinuities: Scanning laser source technique[J]. Materials Evaluation, 2000, 58(2): 173-177.
    [12]

    KROMINE A K, FOMITCHOV P A, KRISHNASWAMY S, et al. Applications of scanning laser source technique for detection of surface-breaking defects[J]. Proceedings of the SPIE, 2000, 4076: 1117-1121.
    [13]

    MEKIE A D W, WAGNER J W, SPICER J B, et al. Laser generation of narrow-band and directed ultrasound[J]. Ultrasound, 1989, 27(6): 323-330.
    [14]

    KIM H, JHANG K, SHIN M, et al. A noncontact NDE method using a laser generated focused-Lamb wave with enhanced defect-detection ability and spatial resolution[J]. NDT & E International, 2006, 39(4): 312-319.
    [15]

    ING R K, FINK M. Directivity patterns of a moving thermoelastic source in solid media[J]. IEEE Transactions on Ultrasonics, Ferroelecirics, and Frequency Control, 1992, 39(2): 285-291. doi: 10.1109/58.139127
    [16]

    CAO D D, WANG K Sh, YANG Y N. Finite element simulation of temperature field of thin tubes irradiated by ring lasers[J]. Laser Technology, 2010, 34(6): 753-756(in Chinese).
    [17]

    DUOCASTELLA M, ARNOLD C B. Bessel and annular beams for materials processing[J]. Laser & Photonics Reviews, 2012, 6(5): 607-621.
    [18]

    SHEN Zh H, YUAN L, ZHANG H Ch, et al. Laser ultrasound in solids[M]. Beijing: The People's Posts and Telecommunications Press, 2015: 53-57(in Chinese).
    [19]

    HE J, XU H J. Power loss of Gaussian beam after passing through a thin lens system[J]. Acta Photonica Sinica, 2000, 29(s1): 444-448(in Chinese).
  • 加载中
通讯作者: 陈斌, bchen63@163.com
  • 1. 

    沈阳化工大学材料科学与工程学院 沈阳 110142

  1. 本站搜索
  2. 百度学术搜索
  3. 万方数据库搜索
  4. CNKI搜索

Figures(16) / Tables(1)

Article views(5304) PDF downloads(21) Cited by()

Proportional views

Numerical study on defect detection by ring light source generated ultrasonic

    Corresponding author: ZHANG Bin, bzhang@bjtu.edu.cn
  • Key Laboratory of Luminescence and Optical Information of Ministry of Education, Beijing Jiaotong University, Beijing 100044, China

Abstract: In order to improve the generation efficiency of laser ultrasonic without damaging the measured surface, the spatial distribution of the laser source was changed, and the pulsed ring laser source was used. Using the finite element method, the numerical simulation of the full field ultrasonic wave generated in the aluminum plate was carried out by COMSOL Multiphysics. The generation characteristics of the superposition shear wave on the central axis of the ring laser source were studied, which vary with laser parameters. By simulating the change law of the ultrasonic field caused by defects, a method of detecting cracks on both sides of the ring laser source was proposed. The feasibility and effectiveness of defect detection by superposition shear wave were verified by simulating the change rule of ultrasonic field caused by defects. The results show that the generation efficiency can be significantly improved by using the ring laser source because ring light source loss is usually less than 50%. The direction of shear wave propagation is stable. The superposition depth of the shear wave is related to the ring radius, and the ring half-width can affect the intensity of the wave. The results provide a reference for the application of ring laser source generated ultrasonic in defect detection.

引言
  • 激光超声是一种高效的无损检测技术,相比于传统超声检测,具有非接触和远距离测量的特点,更加适于恶劣的测量环境以及复杂结构的被测样品,成为学者们的研究重点[1-6]。如何在保证表面无损的情况下,尽可能提高超声波的激发效率, 是激光超声检测应用的关键问题之一。改变光源空间分布形式是一种好的方法,可以兼顾二者。点光源激发是常用方式,已被广泛研究和应用。SONG等人研究了线光源与点光源激发出的超声信号幅值及波形,总结了二者信号的特点与区别[7]。ARIAS等人建立了线激光源激发超声场的模型,探究了超声场与线源宽度、脉冲轮廓、透入深度的关系,并考虑了热扩散效应的影响[8]。SUN等人依据缺陷与线光源激发的超声横波之间的作用规律,实现了对材料内部缺陷的定位[9]。ACHENBACH等人基于线光源激发超声,提出了用于缺陷检测的扫描激光源法、阵列激光源法等[10-15]

    环形光源亦是改变光源空间分布激发超声的一种手段,可以通过使用锥透镜或者空间光调制器来获得。照射被测表面的光束为环形光束,更加适于诸如管道、弯头等特殊形状材料。CAO等人应用环形光源在管状材料中激发出了超声导波[16]。为探究环光源激发超声的规律以及用于缺陷检测的优势,作者利用多物理场耦合软件COMSOL,仿真研究了环形光束照射被测表面激发出的超声全场波形及其传播特性。发现了中心轴上固定角度处汇集的叠加横波,并通过改变环形光源半径和环宽的仿真总结了叠加横波变化规律。模拟了加入不同缺陷情况下超声场的变化情况,提出利用环形光源进行缺陷检测的方法。环光源激发能有效降低激光对被测样品的辐照功率,同时提高超声信号的强度和信噪比。本文中的研究结果为利用叠加横波特性实现缺陷检测和定位提供了参考。

1.   环形光源的产生
  • 与激发超声的点光源和线光源类似,环形光源亦是通过锥透镜或者空间光调制器,对激光源进行空间调制所获得的,是一种环状的激光光斑平面分布形式,其主要参量包括光斑的环宽度以及环半径。使用有限元方法,应用多物理场仿真软件COMSOL Multiphysics,对调制所得环光源照射一铝制均匀圆板(直径20mm,高6mm)激发的超声波场及其传播过程进行分析。由于激光在铝板上的穿透深度仅为10nm,可以忽略不计,因此在仿真中,采用截面为高斯分布的环形光源以面热源的形式加载到物体表面。

    假设热传导的过程中没有热损耗,且材料吸收的能量完全转化为热能,在柱坐标系下环光源的热源形式可以表示为:

    式中, P0是单脉冲激光的能量,R为铝表面对激光的反射率,f(r)和g(t)分别为脉冲激光的空间分布和时间分布[17-18]

    式中, r为半径,t为时间,rc为环形光源的半径,光源截面为高斯分布,rl为光环高斯分布的半宽, t0是激光脉冲上升时间。空间分布的具体形式如图 1所示。

    Figure 1.  The spatial distribution of ring laser source

    热弹激发过程中金属的温度和位移场可用热扩散方程和热弹性方程描述:

    式中, T表示温升,U为位移场,ρ为材料密度,c为材料比热容,α为线膨胀系数,κ为导热系数,λμ为拉梅常数。铝制材料参量如表 1所示。

    heat capacity
    c/(J·kg-1·K-1)
    density
    ρ/(kg·m-3)
    thermal conductivity
    κ/(W·m-1·K-1)
    Young’s modulus
    E/109Pa
    Poisson’s
    ratio
    coefficient of thermal
    expansion α/10-6K-1
    reflection
    coefficient R
    900 2730 155 69 0.33 23.2 0.9

    Table 1.  Table 1 Parameters of aluminum sample

    为达到求解精度和计算速度间的平衡,采用变网格划分方式,激光辐照集中处使用较密网格,超声传播过程中以衰减为主,采用较稀疏网格。网格单元最小为20μm,最大为100μm。采用广义α法求解时间步长,最小时间步长为0.01s,最大时间步长5ns,模拟总时长为5000ns,可以包含超声波的整个传播过程。

2.   模拟与分析
  • 设置rc=3mm,rl=0.3mm,激光在材料表面可以激发出包括横波S,纵波L,表面波R和头波H在内的多种模式超声波,如图 2所示。图 2a~图 2d中分别给出了0.6μs,1.0μs,1.5μs,2.0μs时刻的环形光源激发出的全场波形图。

    Figure 2.  The ultrasonic displacement field

    从图中可以看出,纵波强度较低,速度较快,能量分布较为均匀,方向性不明显;而横波强度较高,速度较低,能量分布不均匀,方向性较明显,因此具有作为缺陷检测波的优势。纵波L和横波S在环形光源中心轴线上都有交汇现象,叠加纵波Ls和叠加横波Ss分别在图 2b图 2c中做出了标示。图 3a中表示出了中轴线上不同位置处随时间变化的位移曲线。依次可以观察到Ls波和Ss波的峰值。Ls波的峰值在中轴线上深度约2mm处达到最大,之后开始递减;Ss波的峰值在深度约4.5mm处达到最大。从图中可知,Ss波的强度比Ls波的强度要高很多,更适合用作检测波。同时可以判断,轴上4.5mm处为Ss波的能量最集中处,峰值宽度较窄,说明横波的传播有较好的方向性。环形光源光环中心A与轴上深度4.5mm处O的连线即为横波的集中传播方向,如图 3b所示,传播角度θ为:

    计算可得θ≈33.4°。

    Figure 3.  a—ultrasonic displacement curves at different depth of central axis over time b—ring laser source and the direction of shear wave propagation

    为探究环形光源的激发效率,在上述铝板样品中建立入射总能量与环形光源模型相同的点光源激发超声模型。点光源空间上为高斯分布,时间分布与环形光源相同。将环形光源激发的超声模型与点光源激发的模型进行比较。图 4是环形光源截面右侧激光作用点处和点光源激光作用点处的波形比较图。与点光源相比,环光源作用点处声波场不再具有对称性,靠近环心一侧的横波能量明显大于传向外侧的横波能量,超声波场的能量有向环形光源中心轴集中的趋势。将同一位置(轴上深度4.5mm处)不同激发源对应的时间相关位移曲线进行比较,所得结果如图 5所示。第1个和第2个峰值分别为纵波和横波在4.5mm处叠加的最大峰值,由于环形光源的叠加效应,其激发出的超声振幅远大于点光源激发出的超声振幅。

    Figure 4.  Waveform near the laser operating point

    Figure 5.  Ultrasonic displacement curves of point laser source and ring laser source over time at the same position

    考虑到环形光源由于激光光源的整形引起光能量的损失,因此将入射环光源能量减半进行模拟,与点光源对比所得结果如图 6所示。可以看出,在能量减半情况下,环形光源激发出的超声振幅仍然大于点光源激发出的超声振幅。在实际使用中调制方式对光源能量的损耗常在50%以下[19],因此环光源激发更加具有应用优势。

    Figure 6.  Ultrasonic displacement curves of point laser source and attenuated ring laser source over time at the same position

    可以看出,环形光源相对于点光源来说,能够降低表面能量集中度,减少表面的损伤可能。环形光源产生的超声波横波会在环源中心轴线上产生叠加,使其在表面能量分散的情况下仍能保持较高的激发强度。由于横波较明显的方向性,在固定的角度处,可以得到强度最大值的Ss波。

  • 为研究Ss波的变化规律,分别改变环形光源半径rc、环半宽rl进行仿真研究。对于上述模型,分别取rc为4.5mm,6mm,为确保获取轴上全部位移信息,将铝板加厚至12mm,保持激光输入能量不变进行模拟。遍历中心轴上点,给出位移达到最大值附近点位移随时间的变化曲线,如图 7所示。

    Figure 7.  The curves of different displacement on the central axis over time

    rc取4.5mm, 6mm时,叠加横波的轴上强度最大位置分别是7mm, 9.5mm,应用(6)式可以得到横波传播方向角分别为32.5°,32.1°,与rc=3.0mm时的方向角33.4°基本一致。可以看出,环形光源半径rc变化不会引起横波传播方向较大的改变,横波叠加波在轴上的叠加点深度d与环形光源半径rc成正比,rc越大,d越大。对于不同rc,皆在固定角度θ下满足如下关系:

    同样地,分别设置环半宽rl为0.6mm,0.9mm时进行激发,结果如图 8所示。可以看出, rl会影响所激发超声场的强度,随着rl的增加,接收点的超声信号会减小。这是因为rl的增加会导致激光辐照位置能rl量集中度的有效降低,从而降低了超声场的激发效率。

    Figure 8.  The displacement curves at 4.5mm depth of central axis over timecorresponding to different r1

  • 由于叠加横波方向性好,且强度高,当材料内部缺陷出现在横波传播路径上时,会阻挡大部分横波能量,导致叠加横波的强度发生变化,因此可以采用光源扫描的方式,通过检测叠加横波的变化来确定缺陷的存在。在上述铝板模型中改变rc使横波聚焦于激发点对面处,在材料内部加入图 9所示方孔型缺陷,改变缺陷的位置,得到模拟结果如图 10所示。当缺陷未处于横波传播路径上时,横波正常于环形光源中心轴上产生叠加,在叠加点可以得到很强的超声信号。当缺陷处于横波传播路径上时,在叠加点测得的超声信号产生明显衰减。当缺陷完全隔绝横波传播路径时,叠加点测得的超声信号进一步衰减,达到最低水平。这证明叠加横波强度在接收端受缺陷影响而产生的变化,可以应用于材料的无损检测中。这种方法有比较高的信噪比,检测手段也相对简单。

    Figure 9.  Schematic diagram of different defect locations

    Figure 10.  The displacement curve of superposition points over time corresponding to different defect positions

    Ss波的具体变化形式,由材料内部缺陷相对于环形光源的大小和位置决定。如图 11所示,光源以速率v扫描移动,当内部缺陷可以完全包含在圆锥体ABO内时,接收端信号由高强度经历两次衰减-恢复过程;当内部缺陷的尺度可以同时阻挡所有横波传播路径时,接收端信号变化规律为由高强度衰减,再恢复至高强度,只经历一次衰减-恢复过程。

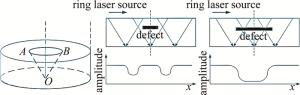
    Figure 11.  Schematic diagram of ring light source defect detection

    依据以上原理,可以采用双面扫描的方式,依据两侧所得超声信号变化的不同规律,得到样品内部缺陷的位置与尺寸信息,具体可分为3种情况。当缺陷的尺度和位置使其两次扫描均可阻挡所有横波传播路径时,双面扫描对应超声信号时域变化如图 12所示。两侧扫描过程所得超声振幅变化均只经历一次衰减-恢复过程,由图中几何关系可知此时裂纹径向长度l和裂纹深度h分别为:

    式中,w为试件的厚度,v为光源移动的速度。

    Figure 12.  Detection schematic diagram of the first case

    当缺陷的尺度和位置使其两次扫描均可全部包含在圆锥体内时,双面扫描对应超声信号时域变化如图 13所示。两侧扫描过程所得超声振幅变化均经历两次衰减-恢复过程,此时裂纹径向长度l与裂纹深度h分别为:

    Figure 13.  Detection schematic diagram of the second case

    当缺陷尺度和位置使其两次扫描变化不同时,双面扫描对应超声信号时域变化如图 14所示。两侧扫描过程所得超声振幅变化分别经历一次和两次衰减-恢复过程,此时裂纹长度l与裂纹深度h适用于(8)式和(9)式。

    Figure 14.  Detection schematic diagram of the third case

    由上可知,可以通过环光源双面扫描的方式,依据两侧超声信号时域变化形式的不同,判断缺陷的尺度和位置的种类,再依据相应公式,可得到裂纹的深度和尺寸信息,实现缺陷的检测和定位。

    为验证方法的可行性,选取分类中的第3种情况进行了数值模拟。缺陷位置和尺寸如图 15所示,为边长4mm,厚0.1mm的扁平裂纹,置于铝板一侧表面以下4mm处。图 16是双面扫描情况下接收点超声信号峰值随光源移动而变化的关系图。光源每移动1mm设置一检测点,在超声信号变化迅速的区域,每0.5mm设置一检测点。由于光源匀速运动,横轴采用光源移动距离代替时间进行划分。可以看出,信号变化的趋势与第3类情况基本相符,按照模拟所得时间信息,代入(8)式、(9)式,得到缺陷的尺寸和深度信息分别为l=4mm和h=4.125mm,与预设的裂纹信息基本相符,可以证明此方法的可行性。

    Figure 15.  Sketch map of defect location and size

    Figure 16.  Relationship between peak value of ultrasonic signal at receiving point and light source in case of double seanning

    还可以看到,在横波传播路径完全阻挡的情况下,在接收点仍可接收到一定强度的超声波,客观上压缩了超声信号受缺陷调制变化的幅度。造成这种现象的原因,一方面是因为有横波可以通过缺陷与另一表面的反射到达接收点,另一方面是因为超声波波长和缺陷尺寸在同一数量级,超声信号在经过缺陷时会发生衍射效应,使其有部分能量绕过缺陷到达接收点。但二者的影响十分有限,并不改变横波叠加点的位置和超声强度的变化趋势,因此环光源双面扫描的方法仍然是一种可行的缺陷检测方法。

3.   结论
  • 建立了环形光源在金属表面激发超声波的模型,并利用有限元的方法分析了环形光源超声波场的激发过程和传播特性。在环形光源分散表面能量的情况下,利用横波良好的方向性在固定角度处找到了环形光源中心轴上的叠加横波场,且其强度比点光源在同位置激发的超声横波更高。横波传播方向不受环形光源半径的影响。环形光源的半径越大,横波在中心轴上叠加点的深度越深。环宽越窄,激发出的超声场强度越高,同样对表面的损伤可能性也越高,这为如何避免表面损伤提供了参考。基于上述理论,可以利用环心叠加横波来检测缺陷,模拟中检验了模型的正确性。结果说明,环形光源是一种良好的光源空间调制方式,能够扩大激光能量,激发出更强的超声波而不至于损伤材料,用于缺陷检测能够获得更高的信号信噪比。提出了一种环形光源双面扫描的缺陷位置和尺寸确定方法,在模拟中验证了方法的可行性,为环形光源激发超声应用于无损检测提供了依据。

Reference (19)

Catalog

    /

    DownLoad:  Full-Size Img  PowerPoint
    Return
    Return