Advanced Search

ISSN1001-3806 CN51-1125/TN Map

Volume 45 Issue 2
Mar.  2021
Article Contents
Turn off MathJax

Citation:

Research on non-destructive identification about vehicle paints by DT-KNN-FDA

  • Corresponding author: JIA Zhenjun, zhenjunjia@163.com
  • Received Date: 2020-03-16
    Accepted Date: 2020-04-08
  • An identification method based on fingerprint spectroscopy combined with decision tree, k-nearest neighbor, and Fisher discriminant analysis (DT-KNN-FDA) model was proposed to achieve the rapid and non-destructive identification of the vehicle paints and performed by theoretical analysis and experimental verification. The infrared absorption spectroscopy for a total of 60 samples of car paint were collected and obtained as the experimental data. Through the selection of characteristic wave numbers, a multi-classification model based on the DT, KNN analysis, and FDA was established and compared. 58 sets of adjustment data were extracted through correlation analysis, and a classification model was constructed based on this. The results show that the overall discrimination accuracy of DT classification model, KNN classification model and FDA classification model for each sample is 77.80%, 72.31%, and 85.00%, respectively; infrared spectroscopy combined with DT-KNN-FDA analysis can realize the distinction between products of different brands is ideal for classification. This method is fast, accurate, and effective, and has certain universality and significance.
  • 加载中
  • [1]

    KRUGLAK K J, DUBNICKA M, KAMMRATH B, et al. The evidentiary significance of automotive paint from the northeast: A study of red paint[J]. Journal of Forensic Sciences, 2019, 64(5): 1345-1358. doi: 10.1111/1556-4029.14007
    [2]

    MALEK M, NAKAZAWA T, KANG H W, et al. Multi-modal compositional analysis of layered paint chips of automobiles by the combined application of ATR-FTIR imaging, Raman microspectrometry, and SEM/EDX [J]. Molecules, 2019, 24(7): 1381. doi: 10.3390/molecules24071381
    [3]

    ISHIKAWA A, HARA S, TANAKA T, et al. Cross-polarized surface-enhanced infrared spectroscopy by fano-resonant asymmetric metamaterials[J]. Scientific Reports, 2017, 7(1): 3205. doi: 10.1038/s41598-017-03545-8
    [4]

    HE X L, WANG J F. The identification about the automotive bumper based on Newton interpolation polynomial-infrared derivative spectroscopy[J]. Laser Technology, 2020, 44(3): 333-337(in Chinese).
    [5]

    HOU W, WANG J F. Rapid identification the black marker ink based on infrared fingerprint spectros copy combined with multilayer perceptron[J]. Laser Technology, 2020, 44(4): 436-440(in Chinese).
    [6]

    JI J H, WANG J F, WANG G X, et al. Raman spectrum identification of waterborne wood coating based on radial basis function[J]. Laser Technology, 2020, 44(6): 762-767(in Chinese).
    [7]

    ZHOU X, SUN J, WU X H, et al. Research on moldy tea feature classification based on WKNN algorithm and NIR hyperspectral imaging[J]. Spectrochimica Acta, 2019, A206(14): 378-383.
    [8]

    ZHENG X, LV G, ZHANG Y, et al. Rapid and non-invasive screening of high renin hypertension using Raman spectroscopy and different classification algorithms[J]. Spectrochimica Acta, 2019, A215(5): 244-248.
    [9]

    WANG G J, XIE C, STANLEY H E. Correlation structure and evolution of world stock markets: Evidence from pearson and partial correlation-based networks[J]. Computational Economics, 2016, 51(3): 607-635. doi: 10.1007/s10614-016-9627-7
    [10]

    ZHOU H, DENG Z, XIA Y, et al. A new sampling method in particle filter based on Pearson correlation coefficient[J]. Neurocomputing, 2016, 216(12): 208-215.
    [11]

    FREDL M A, BRODLEY C E. Decision tree classification of land cover from remotely sensed data[J]. Remote Sensing of Environment, 1997, 61(3): 399-409. doi: 10.1016/S0034-4257(97)00049-7
    [12]

    HE Y, WANG J F. Rapid nondestructive identification of wood lacquer using Raman spectroscopy based on characteristic-band-Fisher-K nearest neighbor[J]. Laser & Optoelectronics Progress, 2020, 57(1): 13001(in Chinese).
    [13]

    HE X L, CHEN L B, WANG J F, et al. Raman spectral analysis of plastic steel Windows based on k-nearest neighbor algorithm [J]. Advances in Laser and Optoelectronics, 2018, 55(5): 053001(in Chinese). doi: 10.3788/LOP55.053001
    [14]

    HE X L, WANG J F, LI Q Sh, et al. Multilayer perceptron-Fisher discriminant analysis based on infra red spectrum identification of vehicle bumper [J]. China Test, 2019, 45(5): 74-78(in Chinese).
    [15]

    HE X L, MA Y, WANG J F, et al. Rapid qualitative and quantitative detection of vehicle bumpers by mid-infrared spectroscopy [J]. Engineering Plastics Applications, 2019, 47(5): 122-126(in Chinese).
  • 加载中
通讯作者: 陈斌, bchen63@163.com
  • 1. 

    沈阳化工大学材料科学与工程学院 沈阳 110142

  1. 本站搜索
  2. 百度学术搜索
  3. 万方数据库搜索
  4. CNKI搜索

Figures(1) / Tables(4)

Article views(4657) PDF downloads(14) Cited by()

Proportional views

Research on non-destructive identification about vehicle paints by DT-KNN-FDA

    Corresponding author: JIA Zhenjun, zhenjunjia@163.com
  • 1. Institute of Criminal Investigation, People's Public Security University of China, Beijing 102600, China
  • 2. School of Public Security and Traffic Management, People's Public Security University of China, Beijing 102600, China

Abstract: An identification method based on fingerprint spectroscopy combined with decision tree, k-nearest neighbor, and Fisher discriminant analysis (DT-KNN-FDA) model was proposed to achieve the rapid and non-destructive identification of the vehicle paints and performed by theoretical analysis and experimental verification. The infrared absorption spectroscopy for a total of 60 samples of car paint were collected and obtained as the experimental data. Through the selection of characteristic wave numbers, a multi-classification model based on the DT, KNN analysis, and FDA was established and compared. 58 sets of adjustment data were extracted through correlation analysis, and a classification model was constructed based on this. The results show that the overall discrimination accuracy of DT classification model, KNN classification model and FDA classification model for each sample is 77.80%, 72.31%, and 85.00%, respectively; infrared spectroscopy combined with DT-KNN-FDA analysis can realize the distinction between products of different brands is ideal for classification. This method is fast, accurate, and effective, and has certain universality and significance.

引言
  • 在交通肇事案件中,执法人员经常会在肇事现场、受害人衣物上发现并提取到车漆碎片。通过对车漆进行分析与鉴定,进一步确定其品牌、生产厂家等信息,进而追溯肇事车辆,从而为确认或排除嫌疑人和嫌疑车辆提供一定的线索,为案件的诉讼和判决提供一定的证据。因此,车漆的检验鉴定对侦破交通肇事案件具有十分重要的意义。

    不同品牌和生产厂家的车漆有不同的配方和工艺,即在成分和其含量上均存在一定差异。即不同品牌的车漆样本间存在一定差异,对这一差异的挖掘将有助于执法人员推断并确定现成提取的碎片检材的品牌和生产厂家。目前,车漆检验主要有光学显微镜法[1]、扫描电镜法[2]和光谱成像技术[3]等。光学显微镜法只能对车漆碎片的形态学特征进行初步解读,这易受主观因素影响,且耗时耗力;扫描电镜法在确定车漆中元素含量上有一定优势,但对其品牌和生产厂家信息的解读不够全面。高发的交通肇事案件和提取到的大量车漆碎片物证给执法人员的工作带来了极大的挑战。如何降低鉴定所需的时间精力等成本,提高鉴定效率,实现对车漆碎片的快速无损鉴定,是当下执法人员关注的重点之一。

    鉴于此,实验中借助红外光谱分析技术,通过对特征波数的选择,建立基于决策树分析(decision tree, DT)、k近邻分析(k-nearest neighbor, KNN)、Fisher判别分析(Fisher discriminant analysis, FDA)的车漆样本光谱分类鉴别模型,从而实现对车身油漆品牌较为准确区分与归类,为法庭科学中车漆无损、准确地检验鉴定提供一定的参考和借鉴。

1.   实验
  • 从市场上收集了常见的诚得利等4种品牌共计60个不同品牌和生产厂家的车漆样本。采集车身前部、两侧、后部共计4处位置的车漆碎片,为避免采集过程中人为因素带来的误差,每处随机采集3份样本。首先,将采集的样本用酒精棉擦拭样品,从而除去样本表面残留的灰尘等污物;而后将样本放入盛有去离子水的烧杯中,并超声清洗2次,每次10min;最后用酒精棉将样本擦拭干净,进样检测。

  • 采用Nicolet 5700型傅里叶变换红外光谱仪(Thermo Fisher Scientific公司),配有衰减全反射附件(Thermo Fisher Scientific公司)[4-5]。光谱数据处理软件OMNIC8.2,光谱采集范围为4000cm-1~400cm-1,每个样本均采集3次,取其平均值作为实验数据[4-5]

2.   结果及分析
  • 实验中获取的数据维度较高,重复信息较多,会增加后期建模计算的时间和复杂度,也会降低模型的精度,这对快速准确地区分各样本有一定影响。因此,筛选并提取特征波数,剔除重复信息十分有必要[6]。ZHOU等人[7]提出了一种基于小波耦合k近邻的特征提取方法建立分类模型用于发霉茶的分类研究。实验中基于不同的小波函数,采用5层小波分解预处理光谱数据,同时借助线性判别分析构建分类模型,有效提取了特征波长并实现了对不同霉变程度的干茶有效分类。ZHENG等人[8]采用主成分分析进行特征提取,缩小光谱数据的维数,同时借助支持向量机,线性判别分析和k最近邻分析建立了分类模型,实现了对高肾素高血压93.5 %地准确筛查,实验结果较为理想。

    实验中采用相关性分析来剔除重复信息,筛选特征波数,通过计算样本数据间的Pearson相关系数和R值来判断样本数据间的相关程度[9-10],以0.95和0.01分别作为Pearson相关系数和R值的阈值。经过反复比较与分析,实验中发现, R值无法较好确定样本数据中信息重复的数据,而Pearson相关系数则较好地区分出了重复数据。因此选择Pearson相关系数为参考基准,开展对特征波数地筛查和提取工作。表 1中列举了其中诚得利品牌一个样本经过筛选后的56组特征波数及其光谱数据。

    characteristic wavenumber/cm-1 spectral data characteristic wavenumber/cm-1 spectral data characteristic wavenumber/cm-1 spectral data characteristic wavenumber/cm-1 spectral data
    501 68.30139 729 70.59264 802 71.68636 922 70.73677
    679 68.22303 733 69.40947 806 71.35540 926 70.43494
    683 67.50737 737 68.54868 810 71.42767 930 70.13481
    687 66.34003 741 67.97828 814 71.63278 1003 70.44617
    690 64.28992 744 67.37168 818 71.80663 1057 67.02615
    694 60.26677 748 66.37009 822 71.85703 1092 66.28056
    698 56.67580 771 70.23232 891 71.66743 1095 65.56648
    702 58.64999 775 71.62344 895 71.50935 1099 64.66272
    706 65.09207 779 72.36163 899 71.30006 1103 63.62498
    710 70.65044 783 72.76534 903 71.05427 1107 62.63717
    714 72.93565 787 72.91515 906 70.95933 1146 59.33903
    717 73.04305 791 72.90823 910 70.95816 1176 63.28623
    721 72.39362 795 72.68170 914 70.95504 1250 71.51285
    725 71.59163 798 72.25454 918 70.89352 1277 73.97288

    以经过关性分析筛选后的56组特征波数光谱数据为基础,建立基于DT、KNN和FDA的分类模型,开展对不同品牌和生产厂家样本的分类工作。

  • DT分析是一种较为有效的分类算法,其分类结构相对简单、明确和直观,不对输入数据的分布做任何假设,并且对于输入要素和类标签之间的非线性和嘈杂关系,具有灵活性和鲁棒性[11]

    以品牌为单位,采用DT构建分类模型,得到了各样本的分类结果(见表 2)。

    brands Chengdeli Munchsett Sanhe Sangmei
    classification accuracy/% 0.00 100.00 94.30 0.00

    Table 2.  Classification results of 4 brand samples by DT

    表 2可知,DT分类模型对不同品牌的样本分类情况均不一样,其中“Munchsett”品牌的样本实现了100.00%的准确区分;“Sanhe”品牌的样本区分准确率为94.30%;“Chengdeli”和“Sangmei”品牌的样本分类正确率均为0.00%。DT分类模型总体分类正确率为77.80%。

  • KNN分析是一种基于距离度量的有效分类方法,主要原理是从训练集中找到和新数据最接近的k条记录,根据其主要分类决定新数据类别,分类过程中只与近邻几个样本相关,不使用额外数据,不需要事先确定类别数量便能达到理想分类效果[12-13]

    以品牌为单位,采用KNN构建分类模型, 得到了各样本的分类结果(见表 3)。

    brands Chengdeli Munchsett Sanhe Sanmei
    classification accuracy/% 0.00 0.00 96.80 25.00

    Table 3.  Classification results of 4 brand samples by KNN

    表 3可知,KNN分类模型对不同品牌的样本分类情况均不一样,其中“Chengdeli”和“Munchsett”品牌的样本分类正确率均为0.00%;“Sanhe”品牌的样本区分准确率为96.80%,“Sangmei”品牌的样本分类正确率均为25.00%。KNN分类模型总体分类正确率为72.31%。

  • FDA分析主要思想是将多维数据投影到某个方向上,将类与类之间尽可能分开,类内尽可能聚合,然后选择合适的判别规则对未知样品进行分类判别[14]

    以品牌为单位,构建Fisher判别分析模型,得到了各样本的判别函数摘要(见表 4)。

    function variance contribution rate/% correlation function test Wilks’lambda significance
    f1 63.7 0.810 1~3 0.153 0.000
    f2 30.0 0.688 2~3 0.444 0.001
    f3 6.3 0.398 3 0.842 0.006

    Table 4.  The abstract of FDA functions about 4 brand samples

    “variancecontributionrate”即方差贡献率,指在此判别函数上各样本的可区分度。“correlation”即相关性,指不同分组与各个函数之间的相关性,相关性越强,则组别在此维度上的差异越大[15]。“Wilks’ lambda”是组内平方和与总平方和之比,其值越小,说明某个量对于模型的影响越显著[15]。“significance”即显著性,若0.01[15]。由表 4可知,Fisher模型构建了3个分类函数即f1, f2以及f3f1=0.003x501+0.470x679-0.366x683+0.422x698-1.361x706+1.267x710-0.538x721-0.026x775+0.099x891+0.02x1092+1.9。f2=-0.013x501+0.497x679-0.71x683+0.224x698-0.418x706+0.776x710-0.068x721-0.7x775+0.308x891+0.057x1092+4.519。f3=0.029x501-0.311x679+0.492x683-0.137x698+0022x706+0.451x710-0.39x721-0.392x775+0.416x891+0.134x1092-4.374。

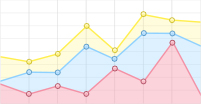
    其中f1方差贡献率最高(63.7%),在f1上各样本的可区分度较高,其次为f2(30.0%)和f3(6.3%)。f1f2的相关性均高于0.65,表明不同分组与f1f2的相关性较强。函数检验中,f1f2的Wilks’ lambda分别为0.154和0.842,表明函数1和函数2对模型影响的显著性较高。f1, f2以及f3的significance均小于0.01,表明差异极显著,能很好解释各样本的分类情况。综上所述,同时选择f1, f2以及f3作为判别函数,构建判别分类模型,得到了4个品牌样本的判别分类图(见图 1)。

    Figure 1.  Distribution of 4 brand samples under FDA model

    图 1可知,不同品牌的样本分布情况各有不同。其中“Sanhe”品牌的样本数据聚敛程度较高,分布较为集中; “Chengdeli”、“Munchsett”和“Sangmei”3个品牌的样本分布相对分散。Fisher判别分类模型对“Chengdeli”品牌的样本实现了100.00%的准确区分,“Munchsett”品牌的样本区分准确率为75.00%,“Sanhe”品牌的样本区分准确率为88.14%,“Sangmei”品牌的样本区分准确率为70.00%。各样本的总体区分准确率为85.00%,分类结果相对较为理想。相对于DT和KNN分类模型,Fisher判别分类模型准确率更高,对各样本的区分能力更强。其对样本光谱数据的分类效果优于DT和KNN分类模型。

3.   结论
  • 本文中采用红外吸收光谱与DT-KNN-FDA方法,实现了对车漆样本较为准确地分类与识别。通过相关性分析筛选出58组的特征数据,以此为基础构建分类模型。DT分类模型、KNN分类模型和FDA分类模型对各样本的总体区分准确率分别为77.80%, 72.31%和85.00%。综上所述,红外吸收光谱结合相关性分析及FDA模型可较好地实现对车漆不同品牌间较为准确地区分,且分类结果较为理想。本实验中在一定程度上消除了传统鉴别方法中因主观判断造成误差、人工鉴别效率较低以及对检材损耗较大的缺点,为车漆的分类鉴别提供了一种新的参考思路,同时,本方法也为其它鉴别手段提供了一定的借鉴。值得注意的是,车漆是多组分样本,对多组分分析是一个挑战,因为不同的分子可能导致相似的光谱形状,使它很难从一个复杂的系统中分离出某些分子信息。因此,如何改进红外光谱技术以满足日益增长的物证分析需求,是今后研究的热点之一。

Reference (15)

Catalog

    /

    DownLoad:  Full-Size Img  PowerPoint
    Return
    Return