Advanced Search

ISSN1001-3806 CN51-1125/TN Map

Volume 45 Issue 3
May  2021
Article Contents
Turn off MathJax

Citation:

Optimization and experimental research on modulation parameters of TDLAS technology

  • Corresponding author: LI Honglian, lihonglian@hbu.edu.cn
  • Received Date: 2020-05-27
    Accepted Date: 2020-06-10
  • In order to study the effect of laser modulation parameters on the peak, signal-to-noise ratio, peak width, symmetry, and signal integrity of second harmonic signals, the analysis based on the hardware system and the Simulink analogue model were verified that the theoretical simulation results were consistent with the signal variation trend of the hardware system, and at the same time the optimal modulation parameters of the CO2 detection system were determined. Through the experimental system, the absorption spectra of different volume fraction of CO2 at 1432.04nm were measured, the inversion model of the signal intensity at the main absorption peak and CO2 volume fraction was established, and the system performance and measurement accuracy were analyzed. The results show that the linear fitting coefficient R2 is 0.9998, the maximum relative error of gas volume fraction inversion is 0.7333%, and the detection limit of the system is 0.0074%. The ideal second harmonic signal can be obtained through the optimal selection of modulation parameters, so as to achieve accurate inversion of the gas volume fraction to be measured. The study provides an important reference for the optimization of modulation parameters in the detection system and provides guidance for the improvement of the measurement accuracy of the system.
  • 加载中
  • [1]

    ZHANG J Q. The research on measurement technology of carbon monoxide gas concentration based on TDLAS[D]. Chengdu: University of Electronic Science and Technology of China, 2011: 19-35(in Chin-ese).
    [2]

    WANG X M. Measurement of CO2 concentration based on TDLAS[D]. Beijing: North China Electric Power University (Beijing), 2017: 1-5(in Chinese).
    [3]

    ZHANG K K. Research on the spectrum absorptive optical gas detection theory and technology[D]. Harbin: Harbin Engineering University, 2012: 26-39(in Chinese).
    [4]

    SUPPLEE J M, WHITTAKER E A, WILFRIED L, et al. Theoretical description of frequency modulation and wavelength modulation spectroscopy[J]. Applied Optics, 1994, 33(27): 6294-6302.
    [5]

    KLUCZYNSKI P, AXNER O. Theoretical description based on Fourier analysis of wavelength-modulation spectrometry in terms of analytical and background signals[J]. Applied Optics, 1999, 38(27): 5803-5815. doi: 10.1364/AO.38.005803
    [6]

    WERLE P W, MAZZINGHI P, AMATO F D, et al. Signal processing and calibration procedures for in situ diode-laser absorption spectroscopy[J]. Spectrochimica Acta, 2004, A60(2): 1685-1705.
    [7]

    GAO N, DU Zh H, TANG M, et al. System parameters selection and optimization of tunable diode laser absorption spectroscopy[J]. Spectroscopy and Spectral Analysis, 2010, 30(12): 3174-3178(in Chin-ese).
    [8]

    SU M R, LI X L, SUN Q Zh, et al. Simulation and experimental investigation on spectrum absorption of TDLS based CO2 sensor[J]. Instrument Technique and Sensor, 2016(7): 4-7(in Chinese).
    [9]

    SHANG H F, DU Zh H, GAO N, et al. Parameter analysis of tunable diode laser absorption spectroscopy based on spectral frequency cha-racteristics[J]. Spectroscopy and Spectral Analysis, 2019, 39(11): 3359-3364(in Chinese).
    [10]

    ARNDT R. Analytical line shapes for Lorentzian signals broadened by modulation[J]. Journal of Applied Physics, 1965, 36(8): 2522-2524. doi: 10.1063/1.1714523
    [11]

    ZHANG X, CAO Sh Y, GUO T X, et al. Research of methane vo-lume fraction field reconstruction based on tunable diode laser absorption spectroscopy detection technology[J]. Laser Technology, 2018, 42(4): 577-582(in Chinese).
    [12]

    ZHAI W, WU Sh Q, DONG Y H, et al. Effect of FM-AM phase difference on the second harmonic lineshape of TDLAS[J]. Laser Technology, 2013, 37(3): 284-288(in Chinese).
    [13]

    GONG X Ch, GAO Y F, YANG J, et al. Parameter optimization of TDLAS wavelength modulation pressure measurement method[J]. Optical Technique, 2020, 46(2): 134-139(in Chinese).
    [14]

    ALORIFI F, GHALY S M A, SHALABY M Y, et al. Analysis and detection of a target gas system based on TDLAS & LabVIEW[J]. Engineering Technology & Applied Science Research, 2019, 9(3): 4196-4199.
    [15]

    LIU X L. The digital signal processing and analysis based on TDLAS[D]. Chengdu: University of Electronic Science and Technology of China, 2015: 58-71(in Chinese).
    [16]

    YUAN Zh G, MA X Zh, LIU X N, et al. Testing on diesel engine emission temperature using tunable laser absorption spectroscopy technology[J]. Chinese Optics, 2020, 13(2): 281-289(in Chin-ese). doi: 10.3788/co.20201302.0281
    [17]

    LI H, LIU J G, HE Y B, et al. Simulation and analysis of second-harmonic signal based on tunable diode laser absorption spectroscopy[J]. Spectroscopy and Spectral Analysis, 2013, 33(4): 881-885(in Chinese).
    [18]

    LI C R. The research based on TDLAS to diesel engine SCR ammonia pollution detection system[D]. Tianjin: Tianjin University of Science and Technology, 2017: 31-39(in Chinese).
    [19]

    DONG Y H, WU Sh Q, ZHAI W, et al. Effect of modulated phase difference on TDLAS signal-to-noise ratio[J]. Laser Technology, 2013, 37(4): 498-502(in Chinese).
    [20]

    YUAN D Ch. Research on fire forest early detection technology based on TDLAS method[D]. Harbin: Northeast Forestry University, 2018: 83-98(in Chinese).
    [21]

    ZHANG B Q, XU Zh Y, LIU J G, et al. Modulation characteristics of laser based on wavelength modulation technology[J]. Spectroscopy and Spectral Analysis, 2019, 39(9): 2702-2707(in Chinese).
    [22]

    ZHANG Ch X. O2 and CO sensing based on tunable diode laser absorption spectroscopy[D]. Hangzhou: Zhejiang University, 2010: 47-67(in Chinese).
    [23]

    ZHENG F, QIU X B, SHAO L G, et al. Measurement of nitric oxide from cigarette burning using TDLAS based on quantum cascade laser[J]. Optics and Laser Technology, 2020, 124: 105963.
    [24]

    LI Ch L, WU Y F, QIU X B. Pressure-dependent detection of carbon monoxide employing wavelength modulation spectroscopy using a herriott-type cell[J]. Applied Spectroscopy, 2017, 71(5): 809-816.
    [25]

    LI Ch L, SHAO L G, JIANG L J, et al. Simultaneous measurements of CO and CO2 employing wavelength modulation spectroscopy using a signal averaging technique at 1.578m[J]. Applied Spectroscopy, 2018, 72(9): 1380-1387.
  • 加载中
通讯作者: 陈斌, bchen63@163.com
  • 1. 

    沈阳化工大学材料科学与工程学院 沈阳 110142

  1. 本站搜索
  2. 百度学术搜索
  3. 万方数据库搜索
  4. CNKI搜索

Figures(12) / Tables(1)

Article views(4888) PDF downloads(18) Cited by()

Proportional views

Optimization and experimental research on modulation parameters of TDLAS technology

    Corresponding author: LI Honglian, lihonglian@hbu.edu.cn
  • 1. School of Quality and Technical Supervision, Hebei University, Baoding 071002, China
  • 2. National and Local Joint Engineering Research Center of Metrology Instrument and System, Hebei University, Baoding 071002, China

Abstract: In order to study the effect of laser modulation parameters on the peak, signal-to-noise ratio, peak width, symmetry, and signal integrity of second harmonic signals, the analysis based on the hardware system and the Simulink analogue model were verified that the theoretical simulation results were consistent with the signal variation trend of the hardware system, and at the same time the optimal modulation parameters of the CO2 detection system were determined. Through the experimental system, the absorption spectra of different volume fraction of CO2 at 1432.04nm were measured, the inversion model of the signal intensity at the main absorption peak and CO2 volume fraction was established, and the system performance and measurement accuracy were analyzed. The results show that the linear fitting coefficient R2 is 0.9998, the maximum relative error of gas volume fraction inversion is 0.7333%, and the detection limit of the system is 0.0074%. The ideal second harmonic signal can be obtained through the optimal selection of modulation parameters, so as to achieve accurate inversion of the gas volume fraction to be measured. The study provides an important reference for the optimization of modulation parameters in the detection system and provides guidance for the improvement of the measurement accuracy of the system.

引言
  • 近年来,环境问题引起了人们的广泛关注。为了对环境污染进行有效监测与控制,需要一系列新型传感器。基于可调谐二极管激光吸收光谱(tunable diode laser absorption spectroscopy, TDLAS)技术的气体测量系统可实现实时在线、非接触式测量,逐渐得到了国内外气体监测领域的关注。

    TDLAS系统中最常用的是波长调制技术,通过低频扫描信号与高频调制信号叠加对激光器的输出波长进行调制,经过待测气体吸收后将得到的带有气体体积分数信息的光谱吸收信号进行解调从而实现待测气体体积分数反演。光谱吸收信号与扫描信号、调制信号的幅值、频率等因素有关,并且各调制参量对谐波信号的影响方式和程度存在较大差异,因此, 需要根据不同的测量目的与条件选择合适的调制参量[1-3]

    国内外学者对调制参量的优化进行了诸多研究。SUPPLEE[4]和KLUCZYNSKI[5]等人从理论上对调制度和调制频率进行了研究。WERLE等人[6]较为全面地阐述了TDLAS系统原理, 并分析了调制度、调制频率与扫描频率对信号的影响。GAO等人[7]通过实验观察二次谐波信号随调制参量的变化情况,得出了调制参量的具体优化方案。SU等人[8]研究了谐波强度随激光器调制参量的变化情况,并采用叠加平均和积分的方法处理检测信号。SHANG等人[9]从谱线频域角度对调制参量进行优化,提高了测量精度。

    目前TDLAS技术调制参量优化的研究中,基本都是根据理论或实验单方面得出调制参量的优化方案。为对实验调制参量的优化进行理论指导,并通过实验系统验证理论模拟的准确性,本文中结合TDLAS实验系统与Simulink理论仿真分析了激光调制参量对二次谐波信号特征的影响,验证了硬件实验系统与理论模拟的信号变化规律具有相关性,总结了TDLAS技术的调制参量优化依据。基于优化后的调制参量,通过实验系统对不同体积分数CO2吸收光谱进行了测量,建立了主吸收峰处信号强度与不同体积分数CO2的反演模型,分析了系统性能及测量精度。该研究为调制参量的优化提供了参考,为系统测量精度的改善提供了指导。

1.   理论基础
  • 朗伯-比尔定律可以表征待测气体介质对光强的吸收能力。当激光器发出一定频率的光通过待测气体介质时,待测气体介质会吸收部分光强,输出光强可以表示为:

    式中,I(ν)为透射光强;I0(ν)为入射光强;ν为激光发射频率;α(ν)为气体的吸收系数;S(T)为气体吸收线强, T为温度;g(ν)为谱线的线型函数;p为压强;φ为气体体积分数;L为吸收光程长度。待测气体体积分数可根据上述公式计算[10]

    由于光谱吸收线强非常微弱,一般采用波长调制技术通过低频扫描信号与高频调制信号叠加对激光器的输出波长进行调制。激光器的输入电流变化时,激光频率与光强都受到相应的调制,具体调制公式分别为:

    式中,ν0为激光器中心频率,t为采样时间。sawtooth为低频锯齿信号,用于实现波长扫描通过选定范围的气体吸收线,sin为高频正弦信号,目的是提取高频的谐波信号; a1a2分别为扫描幅度与调制幅度; f1f2分别为扫描频率与调制频率。从上述公式可以看出, 吸收信号是由低频锯齿信号与高频正弦信号的频率、幅值等因素共同决定的[11-13]

2.   实验系统与仿真建模
  • TDLAS实验系统原理图见图 1。由调制信号发生器产生的扫描信号和调制信号叠加后通过激光控制器将电压信号转变为电流信号,激光控制器向激光器提供工作所需的电流和温度,使其输出一定波长范围的激光,而后经准直器准直进入气体池被待测气体吸收后,被光电探测器将光信号转换为电信号,再由锁相放大器对其进行解调输出谐波信号。在进行气体检测时,先将动态稀释校准仪配比出一定体积分数的待测气体通入气体池中,待气体体积分数稳定后进行测量。最后用数字示波器与LabVIEW采集程序对所测的信号进行数据采集[14],并由ORIGIN软件对所测信号进行分析处理。本文中所使用的激光器为分布式反馈激光器(distributed feedback,DFB)。

  • 在分析TDLAS系统的建模原理后,基于MATLAB 2018a中的动态仿真工具建立气体测量仿真模型见图 2。仿真模型由光源模块、气室模块、数据检测模块组成[15-17]

    本文中在常温常压下对CO2体积分数进行检测,因此,碰撞加宽对气体分子吸收谱线影响较大,故气体吸收谱线选用洛伦兹线型, 其模型根据下式构建:

    式中,gL(ν, ν0)为洛伦兹线型函数,rL为线型函数的半峰全宽。

    洛伦兹线型仿真模型见图 3

    Figure 3.  Simulation model of Lorentzian curve

    半峰全宽rL根据下式计算:

    式中,激光器中心频率ν0、压力展宽系数r0和温度系数n均可查阅HITRAN数据库可知。气体分子密度根据下式构建:

    气体分子密度仿真模型见图 4

    Figure 4.  Simulation model of Gas molecular density

    一定温度下的气体吸收谱线强度S(T)可以根据下式仿真:

    式中,S(T0)为在参考温度T0下的吸收谱线强度, h为普朗克常量, k为玻尔兹曼常数, c为光速, E为分子跃迁低态能量,Q为配分函数,在很大程度上决定了谱线吸收线强S(T)与温度的关系。

    气体吸收谱线强度仿真模型见图 5

    Figure 5.  Simulation model of line intensity

    上述TDLAS仿真系统模型具有很强的通用性,根据HITRAN数据库查阅参量进行设置,可对不同种类的气体进行虚拟监测并观察不同体积分数、温度、压强对气体吸收曲线的影响情况。

3.   调制参量的优化选择
  • 本文中分别从Simulink建模仿真与实验系统测量两方面对比分析了二次谐波信号峰值、信噪比、对称性、峰宽以及信号完整性与调制参量之间的关系,总结出了各调制参量对二次谐波(2f)的影响以及优化选取方法。其中峰高由信号峰值与基线之差计算;根据2f信号峰值与无吸收处的噪声幅值之比计算出系统二次谐波信噪比,由于此处信号噪声比值单位相消,因此信噪比无量纲;对称性好坏根据谐波左右两侧峰谷值之比是否接近1来衡量,峰谷比值单位相消无量纲;峰宽根据信号两个峰谷之间的距离来确定,此处根据采样点数衡量。

  • 当调制幅度较小时,无法获得明显的谐波信号,随着调制幅度的增加谐波线型逐渐趋于完整。保持其它参量不变,测得180mV~500mV范围内不同调制幅度在实验与Simulink仿真下的2f信号变化情况。由图 6a图 6b可知,峰值随调制幅度增大而增大,信噪比(signal-to-noise ratio,SNR)与峰值变化趋势相同,当调制幅度增加到400mV以后,峰值及信噪比上升趋势变缓。由图 6c可知,随调制幅度增加线型对称性逐渐变好,但调制幅度超过一定范围,谐波信号对称性反而会变差。这是由于奇次谐波分量和剩余幅度调制等干扰因素存的存在,导致关于中心波长对称的偶次谐波信号两边峰谷值不完全相同,因而对称性可以评价被测信号受干扰的程度,在选择调制参量时应尽量保证信号有较好的对称性[18]。由图 6d可知, 峰宽随着调制幅度的增加单调递增,但在测量过程中峰宽过大会受相邻谱线的干扰。因此,应考虑到相邻谱线间的干扰选择合适的调制参量。Simulink模拟结果变化趋势与实验结果基本吻合。综合上述因素,测量系统调制幅度在300mV~350mV范围内选取较为合理。

    Figure 6.  2f signal characteristic with different modulation amplitude

  • 保持其它参量不变,观察调制频率在7kHz~50kHz范围内2f信号的变化情况,见图 7。幅值随调制频率的增大单调递减,信号对称性没有明显的单调变化趋势,峰宽单调递减,信噪比除10kHz外整体趋势变差。从理论上讲,较高的调制频率对噪声的抑制效果也较好。事实上,调制频率增大到一定值,检测器1/f噪声抑制效果变缓[19],因而没有必要继续提高调制频率。另一方面,调制频率过高会增加系统的硬件成本,因此必须选择适当的调制频率才能得到较好二次谐波信号[20]。结合上述因素,选择最佳调制频率范围为10kHz~40kHz。

    Figure 7.  2f signal characteristic with different modulation frequency

  • 选择100mV~600mV范围内的扫描幅度观察2f信号变化情况。当扫描幅度较小时,无法显示完整的二次谐波线型。当其逐渐增大时,二次谐波信号开始趋于完整。由图 8a~图 8d可知,扫描幅度对峰值与信噪比的影响较小,谐波对称性逐渐变好,但线宽逐渐减小。当扫描幅度增大到一定范围时,由于激光器的波长扫描范围逐步变大,相邻吸收峰也会随之出现。因此在确定扫描幅度时应在保证谐波信号完整性的基础上再考虑信号特征。Simulink仿真变化趋势与实验结果基本吻合。综合上述分析对比可知,要想获得完整的二次谐波,扫描幅值范围应选取300mV~500mV较为合理。

    Figure 8.  2f signal characteristic with different scanning amplitude

  • 观察扫描频率在5Hz~70Hz范围内2f信号的变化情况。扫描频率决定信号频率,单周期扫描时间随扫描频率的增加而减少,若采样率不变,单周期内的采样点也会相应减少从而导致信号精度降低。与此同时,扫描时间减少将会加快检测速度[21]。因此要根据具体检测环境选取合适的扫描频率。因本文中属于气体环境监测,对检测精度要求更高,所以在保证信号特征较佳的前提下,应选择较小的扫描频率以保证测量精度准确。由图 9a~图 9d可知,随着扫描频率的增加,信号峰值、信噪比及峰宽均随扫描频率的增加而单调递减,对称性整体趋势逐渐变好,但扫描幅值超过一定范围会导致对称性变差。综合上述分析,当扫描信号频率取10Hz时,二次谐波信号波形最佳。

    Figure 9.  2f signal characteristic with different scanning frequency

    结合以上参量优化原则与本文中的实验系统,确定系统最佳调制参量为:调制频率为10kHz,调制幅值为300mV,扫描频率为10Hz,扫描幅值为400mV。由于实验在稳定大气环境下进行监测,大气湍流等瞬变过程对信号的影响较小可以忽略,因此可采用较小的扫描频率。

4.   气体体积分数测量实验与分析
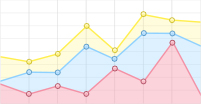
  • 保持气体池压强为101kPa,温度为296K,根据确定的最佳调制参量进行CO2体积分数测量实验。每测量一个体积分数前都将高纯N2通入气体池中,以保证残余气体尽量排出气体池外,使实验结果尽可能准确。将预先配置好的体积分数为0.001, 0.003, 0.005, 0.007, 0.008, 0.009的CO2(背景气体为N2)依次通入气体池,待气体体积分数稳定后进行测量。在对吸收信号进行采集时,应对不同体积分数CO2进行10次测量累加求取平均值以减小噪声的影响。将采集得到的吸收信号进行平滑滤波处理,得到不同体积分数CO2的2f信号, 见图 10

    Figure 10.  2f signals of CO2 of different volume fraction

    提取各组数据的最强吸收峰,对吸收峰与不同体积分数CO2进行拟合。由图 11拟合曲线所示,二次谐波信号峰值与实验中选取CO2体积分数具有很好的线性关系[22-23],线性拟合系数R2=0.9998。对二次谐波信号峰值进行体积分数反演并求得其相对误差如表 1所示,测得的最大相对误差为0.7333%。可见,通过调制参量的优化选择可以获得较为理想的二次谐波信号,从而实现待测气体体积分数的精确反演。

    Figure 11.  Linear fitting result of volume fraction inversion

    gas volume
    fraction
    peak of main
    absorption
    linear fitting inversion
    volume fraction
    relative
    error/%
    0.0015.53180.0009980.2000
    0.00312.41690.0029780.7333
    0.00519.48870.0050110.2200
    0.00726.50090.0070280.4000
    0.00830.05770.0080500.6250
    0.00933.13220.0089350.7222

    Table 1.  Gas volume fraction measurement and inversion results

  • 为测量系统检测限,测得体积分数为0.001的CO2的二次谐波信号见图 12。根据2f信号峰值均值(USV=5.5381V)和无吸收处的噪声幅值(USD=0.1365V)之比计算出该系统二次谐波信噪比RSNR[24]≈40.5722,检测限[25]计算公式为:

    Figure 12.  2f signal of CO2 at 0.001 volume fraction

    式中,Q为测量系统进样量,N为测量过程中的噪音,I为信号响应值。I/N即为该进样量下的信噪比RSNR。利用以上公式对体积分数为0.001时系统的检测限进行估算,其中进样量即气体体积分数,此时系统信噪比RSNR=40.5722,可获得系统检测限为:D=3×0.001/40.5722≈0.0074%。

5.   结论
  • 此前TDLAS技术调制参量优化的研究, 基本都是根据理论或实验单方面得出调制参量的优化方案。本文中基于Simulink理论进行仿真与实验系统的搭建,研究了TDLAS技术调制参量对二次谐波信号峰值、信噪比、峰宽、对称性以及信号完整性的影响,确定了最佳调制参量选取原则,达到了理论模拟指导实验进行的目的。同时实验系统与理论模拟结果具有一致性,验证了系统仿真的准确性。基于优化后的调制参量,对搭建的实验系统在常温(293K)常压(101kPa)下对不同体积分数的CO2在1432.04nm处的吸收光谱进行了测量,建立主吸收峰处信号强度与CO2体积分数的反演模型,线性拟合系数R2=0.9998,气体体积分数反演最大相对误差为0.7333%。分析系统检测性能可得系统在CO2体积分数为0.001时信噪比为40.5722,检测限为0.0074%。该研究为TDLAS技术调制参量的优化提供了依据,为系统测量精度的改善提供了指导。

Reference (25)

Catalog

    /

    DownLoad:  Full-Size Img  PowerPoint
    Return
    Return