Advanced Search

ISSN1001-3806 CN51-1125/TN Map

Volume 45 Issue 4
Jun.  2021
Article Contents
Turn off MathJax

Citation:

Optical sensor for low concentration blood glucose detection based on liquid-core MTC

  • Corresponding author: WAN Hongdan, hdwan@njupt.edu.cn
  • Received Date: 2020-08-17
    Accepted Date: 2020-10-20
  • In order to achieve blood glucose concentration detection with ultra-low sample volume and high sensitivity, the influence of the wall thickness and diameter of liquid-core microtube cavity(MTC) on whispery gallery mode(WGM) resonance property was analyzed based on finite-difference time-domain(FDTD) method. The MTC was fabricated by melt-taping method. High-precision coupling of MTC and tapered fiber and the excitation of WGM resonance spectrum were realized by high-precision electronically controlled displacement platform. The surface functionalization and over-coupling methods of MTC were carried out to improve sensitivity and stability. Theoretical analysis and experimental verification have been carried out. The experimental results show that the linearity and sensitivity of the surface functionalized liquid-core MTC sensor are 0.988 and 0.911pm/(mmol· L-1), respectively. The low-concentration blood glucose optical sensor has high sensitivity and stability. This result is helpful for real-time and rapid monitoring of blood sugar during training of athletes, and for ensuring the safety and durability of sports.
  • 加载中
  • [1]

    CUI Y Q, DAI K X. Sugar supplement and exercise ability [J]. Sports World (Academic Edition), 2008(6): 116-118(in Chin-ese).
    [2]

    LI L. Research on sugar supplement and improvement of endurance sports ability [J]. Sports World (Academic Edition), 2014(6): 124-125(in Chinese).
    [3]

    REN J H. Research on the influence of sugar supplement before competition on middle school students' endurance sports-taking Wuji ju-nior middle school in Shijiazhuang as an example [J]. Sports World (Academic Edition), 2017(11): 63-65(in Chinese).
    [4]

    ZHANG H Sh, WANG J. Some thoughts on sports rehydration [J]. Chinese Sports Coaches, 2015, 23 (4): 61-61(in Chinese).
    [5]

    YI M Q, ZHOU L L, ZHENG Sh Q, et al. Study on the supplement of sugar for cyclists [J]. Chinese Journal of Sports Medicine, 1999, 18 (1): 76-78(in Chinese).
    [6]

    XIAOFENG SOCIETY. Grief! After several marathons in China, two athletes died suddenly before the finish line: Blindly following the trend is not advisable [EB/OL]. (2019-10-21)[2020-08-14]. https://baijiahao.baidu.com/s?id=1647990350787957669&wfr=spider&for=pc (in Chinese).
    [7]

    PENG R X, XU W J, ZHANG Sh, et al. Measurement of blood sugar and blood lactate before and after middle and long-distance running[J]. Journal of Dalian University, 2004, 25(4): 83-85(in Chin-ese).
    [8]

    WU P. Research on glucose concentration measuring method based on fiber optic surface plasmon resonace technique[D]. Tianjin: Tianjin University, 2008: 3-14 (in Chinese).
    [9]

    MENG Q L, ZHANG Y, SHANG J. Nondestructive detection of apple defect combining optical fiber spectra with pattern recognition[J]. Laser Technology, 2019, 43(5): 676-680 (in Chinese).
    [10]

    ZHONG Y Q, YUAN X H, PENG Q B, et al. Effect of fingertip blood sampling on accuracy of rapid blood glucose level in ophthalmic patients[J]. International Journal of Nursing, 2018(1): 1723-1726(in Chinese).
    [11]

    ZHANG H Y. Study on nir spectroscopy application in human blood glucose noninvasive measure[D]. Changchun: Changchun Institute of Optics, Fine Mechanics and Physics of Chinese academy of Sciences, 2005: 17-25(in Chinese).
    [12]

    WAN H D, LIU L Q, DING Z Q. et al. Single-longitudinal-mode, narrow bandwidth double-ring fiber laser stabilized by an efficiently taper-coupled high roundness microsphere resonator[J]. Optics & Laser Technology, 2018, 102: 160-165.
    [13]

    LIN N, JIANG L, WANG S M, et al. Simultaneous measurement of refractive index and temperature using a microring resonator[J]. Chinese Optics Letters, 2012, 10(5): 052802. doi: 10.3788/COL201210.052802
    [14]

    ZHANG F, WU G Zh, WANG Ch Ch. Influence of surface curvature on mode and sensing characteristics of quartz capillary microbo-ttles[J]. Laser Technology, 2018, 42(6): 840-844(in Chinese).
    [15]

    FOREMAN M R, SWAIMJ D, VOLLMER F. Whispering gallery mode sensors[J]. Advances in Optics and Photonics, 2015, 7(2): 168-240. doi: 10.1364/AOP.7.000168
    [16]

    REYNOLDS T, HENDERSON M R, FRANCOIS A, et al. Optimization of whispering gallery resonator design for biosensing applications[J]. Optics Express, 2015, 23(13): 17067-17076. doi: 10.1364/OE.23.017067
    [17]

    ZHOU Q, CHEN Y, HAN F K, et al. Liquid-core, thin-wall microcapillary electric field sensor with high quality factor[J]. Acta Photonica Sinica, 2020, 49(2): 0223002(in Chinese). doi: 10.3788/gzxb20204902.0223002
    [18]

    ZHANG H W, LIU B, SONG B B, et al. Acoustooptic-mode-coupling-based whispering gallery mode excitation in silica-capillary microresonator[J]. Journal of Lightwave Technology, 2017, 35(2): 220-224. doi: 10.1109/JLT.2016.2638467
    [19]

    LANE S, WEST P, FRANCOIS A, et al. Protein biosensing with fluorescent microcapillaries[J]. Optics Express, 2015, 23(3): 2577-2590. doi: 10.1364/OE.23.002577
    [20]

    NADGARAN H, POURMAND R. Ultra-sensitive optical biosensor based on whispering gallery modes: The effect of buffer solutions refractive index on their sensitivity and performance[J]. Journal of Biomedical Physics & Engineering, 2013, 3(2): 57-62.
    [21]

    ROBISON H M, BAILEY R C. A guide to quantitative biomarker assay development using whispering gallery mode biosensors[J]. Current Protocols in Chemical Biology, 2017, 9(3): 158-173. doi: 10.1002/cpch.23
  • 加载中
通讯作者: 陈斌, bchen63@163.com
  • 1. 

    沈阳化工大学材料科学与工程学院 沈阳 110142

  1. 本站搜索
  2. 百度学术搜索
  3. 万方数据库搜索
  4. CNKI搜索

Figures(12) / Tables(1)

Article views(8331) PDF downloads(16) Cited by()

Proportional views

Optical sensor for low concentration blood glucose detection based on liquid-core MTC

    Corresponding author: WAN Hongdan, hdwan@njupt.edu.cn
  • 1. SWAT School, Nanjing Forest Police College, Nanjing 210023, China
  • 2. College of Electronic and Optical Engineering, Nanjing University of Posts and Telecommunications, Nanjing 210023, China

Abstract: In order to achieve blood glucose concentration detection with ultra-low sample volume and high sensitivity, the influence of the wall thickness and diameter of liquid-core microtube cavity(MTC) on whispery gallery mode(WGM) resonance property was analyzed based on finite-difference time-domain(FDTD) method. The MTC was fabricated by melt-taping method. High-precision coupling of MTC and tapered fiber and the excitation of WGM resonance spectrum were realized by high-precision electronically controlled displacement platform. The surface functionalization and over-coupling methods of MTC were carried out to improve sensitivity and stability. Theoretical analysis and experimental verification have been carried out. The experimental results show that the linearity and sensitivity of the surface functionalized liquid-core MTC sensor are 0.988 and 0.911pm/(mmol· L-1), respectively. The low-concentration blood glucose optical sensor has high sensitivity and stability. This result is helpful for real-time and rapid monitoring of blood sugar during training of athletes, and for ensuring the safety and durability of sports.

引言
  • 血糖是人体运动供能的主要来源,血糖值代表着血液中的葡萄糖浓度。人体经过长时间的剧烈运动会出现在运动中或运动后的低血糖现象,血糖降低会导致头晕、恶心、呕吐等不适,严重者可能出现休克或者死亡[1-3]。这种现象常见于羽毛球运动、马拉松运动、自行车运动等项目中[4-6]

    近年来,在体育竞赛和运动训练中发生了多起运动员因血糖过低导致猝死事件,如2019年, 龙口马拉松赛两名参赛选手因机体血糖严重匮乏而死亡[1]; 2019年, 黑龙江佳木斯马拉松赛,一名49岁男子在参赛过程中因运动性低血糖突然猝倒[6]。由此可见,竞赛和运动训练中实时、准确、高效地检测运动员血糖水平显得尤为重要。目前,监测运动员血糖值的重要方法仍是指尖采血[7-8]。然而,指尖采血方法流程相对复杂,基于酶催化法来检测血糖测试结果反馈时间长,且样本采集量通常为毫升量级。据研究,光谱信号检测方法具有实时、快速的特点[9],是血糖检测最有前景的方法[10]。红外光谱方法采用红外光穿透人体皮肤实现人体血糖的无损检测,然而实际人体血液环境带来的背景噪声较大,使得实际测试结果的灵敏度和准确性受到影响[11]。因此,目前已有的葡萄糖浓度检测方法仍然存在用时长、灵敏度相对较低、测试速度以及样本采集量高等缺陷。光学微腔作为一种特殊的光学器件,一方面,具有窄带光谱特性,可以用来实现激光器的选模功能[12];另一方面,具有Q值高、腔内能量密度高、全光纤等优势,可用于传感领域[13-16]。相比于实心微腔,空心微腔可以作为液体的传输通道, 实现了液体传输与检测通道二合一,可用于检测微量的液体[17-19]。通过锥形光纤对齐进行微腔耦合,激发高Q值回音壁模式(whispery gallery mode, WGM)共振谱,其腔内WGM共振谱对外界环境或者介质特性具有较高的光敏感特性,已成为生物分子、气体化学成分等生化检测应用的重要方法[20-21]

    本文中提出一种基于液芯微管腔(microtube cavity, MTC)的低浓度血液葡萄糖光学传感器,实现了超低样本体积、高灵敏度的葡萄糖浓度检测,利用石英毛细管熔融拉锥方法制备了品质因子Q>106的玻璃微腔;通过对MTC的表面功能化, 提高了传感器的灵敏度和稳定性;该传感器具有很高的线性度,灵敏度约为0.911pm/(mmol/L),最小可检测葡萄糖浓度为2.65mmol/L,检测样液体积约为90nL。该传感器在实现运动员血糖的实时、快速监测方面具有重要的研究意义。

1.   传感器原理
  • 传感器由中空柱状MTC和锥形光纤组成,其结构图如图 1所示。图中圆环代表MTC,直线代表锥形光纤,圆环中的黑色部分为液芯,圆环与之间的间隔为耦合间距。MTC外径和壁厚t分别设置为10μm和0.6μm,锥形光纤锥区直径为1μm。微管腔和锥形光纤材料均为石英,折射率为1.4446,MTC和锥形光纤的耦合间距为d

    Figure 1.  MTC and tapered fiber coupling model observed by FDTD

    使用时域有限差分(finite-difference time-domain, FDTD)算法仿真在不同d时MTC的WGM光谱。受计算机运行内存的限制,所构建的模型尺寸小于实验制备的器件尺寸。仿真时网格精度设置为100nm,光源波长范围1.5μm~1.6μm,扫描精度为1pm。如图 2所示,保持直径不变,采用壁厚t从0.7μm~1.1μm的MTC与锥形光纤耦合。取耦合间距d为0.4μm~0.8μm时进行分析,比较不同d的WGM谱特性。当MTC壁厚为0.7μm时,(Q值最高)最佳耦合间距dopt= 0.7μm;当MTC壁厚为0.8μm时,最佳耦合间距为0.7μm;当MTC壁厚为1μm时,最佳耦合间距为0.6μm;当MTC壁厚为1.1μm时,最佳耦合间距为0.5μm。MTC壁厚从0.7μm增加到1.1μm,最佳耦合间距从0.7μm逐渐减小至0.5μm。仿真结果表明,增加MTC的壁厚,最佳耦合间距d逐渐减小。

    Figure 2.  Optimal coupling spacing of MTC with different wall thickness

    当空心MTC中注入溶液时,MTC内外壁的倏逝场将重新分布,因而耦合条件会发生改变。向上述MTC中注入折射率为1.36的溶液,形成液芯MTC。将不同壁厚的液芯MTC与锥形光纤耦合,壁厚t从0.7μm增加到1.1μm,耦合间距从0μm以0.1μm的步长逐渐增加。如图 3所示,取耦合间距0.3μm~0.7μm分析可知,增加MTC壁厚,回音壁模共振谱红移。取耦合间距0.3μm~0.7μm分析可知,增加液芯MTC壁厚,其WGM共振谱红移。在同一壁厚条件下,不同耦合间距激发的共振波长位置不变。当液芯MTC壁厚为0.7μm时,最佳耦合间距dopt=0.5μm,Q=3×10³;当液芯微管腔的壁厚为0.9μm时,最佳耦合间距为0.5μm,Q=2.9×10³;当液芯微管腔的壁厚为1.0μm时,最佳耦合间距为0.4μm,Q=2.8×10³;当液芯微管腔的壁厚为1.1μm时,最佳耦合间距为0.4μm,Q=2.9×10³。由此可知,当液芯MTC的壁厚从0.9μm增加到1.1μm时,其与锥形光纤的最佳耦合间距从0.5μm逐渐减小为0.4μm。通过与上述空心MTC的最佳耦合间距仿真对比可得,同样壁厚的液芯MTC与锥形光纤的最佳耦合间距小于空心MTC与锥形光纤耦合的最佳耦合间距。

    Figure 3.  Optimal coupling spacing of MTC core with different wall thickness

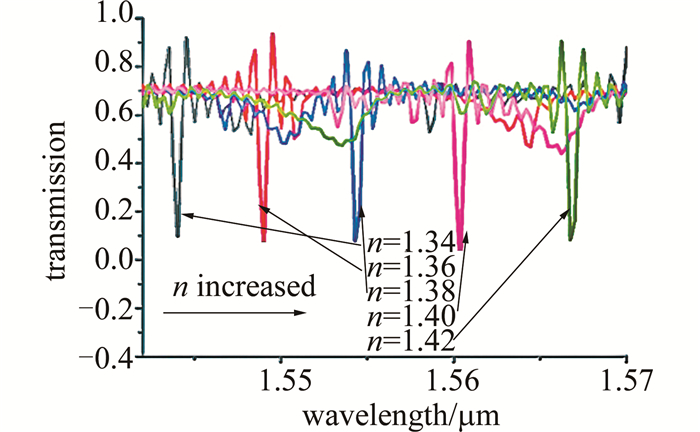
    当向MTC中注入液芯时,液芯的折射率变化会引起WGM共振谱的漂移。向直径为20μm、壁厚为0.8μm的MTC中注入不同折射率的溶液形成液芯微管腔,液芯折射率为1.34~1.42,折射率增加步长为0.02。根据上述液芯微管腔与锥形光纤的最佳耦合分析,将耦合间距设置为0.4μm。如图 4所示,液芯折射率的增大导致WGM共振谱波长红移,且液芯折射率越大,共振波长漂移量越大。这是因为液芯的折射率越大,MTC与液芯的折射率差越大,因而使更多的倏逝场能量分布于微管腔的内壁附近。折射率变化范围为1.34~1.42,相邻折射率的波长漂移量分别为:4.99nm, 5.28nm, 6.08nm, 6.38nm。

    Figure 4.  WGM resonance spectra of MTC core with different refractive index

    由共振条件2πRneff=(其中,R是微腔半径,m为不小于1的正整数)可知,当微腔的结构参量发生变化时,会引起共振波长λ的改变。因此当液芯MTC的壁厚发生改变时,微腔的有效折射率neff发生变化,共振波长λ发生漂移。取液芯MTC的壁厚分别为0.7μm, 0.8μm, 0.9μm, 1.0μm,与直径为1μm的锥形光纤耦合,耦合间距为400nm。如图 5所示,向不同壁厚的液芯MTC中注入折射率为1.34~1.42的液芯,折射率步长为0.02。液芯折射率增大,共振波长发生红移。液芯MTC的壁厚不同,共振波长的漂移量不同。液芯MTC的壁厚为0.7μm,共振波长漂移量为30.07nm;液芯MTC的壁厚为0.8μm,共振波长漂移量为22.73nm;液芯MTC壁厚为0.9μm,共振波长漂移量为17.08nm;液芯MTC的壁厚为1.0μm,共振波长漂移量为12.58nm。仿真结果表明,随着液芯MTC的壁厚减小,共振波长漂移量增大,微腔对液芯折射率变化的敏感性增强。

    Figure 5.  WGM resonance spectrum of MTC core with different wall thickness
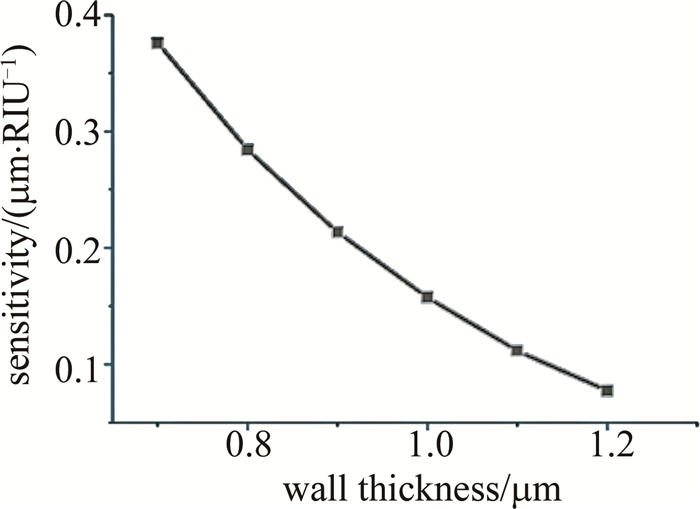
    由公式Sλn(其中,Δn表示折射率变化)可知,液芯微管腔的折射率传感灵敏度S与共振波长的漂移量Δλ成正比。如图 6所示,液芯微管腔的壁厚为0.7μm,折射率传感灵敏度为0.3759μm/RIU;液芯微管腔壁厚为0.8μm,折射率传感灵敏度为0.2841μm/RIU;液芯微管腔壁厚为0.9μm,折射率传感灵敏度为0.21345μm/RIU;液芯微管腔壁厚为1.0μm,折射率传感灵敏度为0.15725μm/RIU;液芯微管腔壁厚为1.1μm,折射率传感灵敏度为0.1117μm/RIU;液芯微管腔壁厚为1.2μm,折射率传感灵敏度为0.07725μm/RIU,即随着液芯微管腔壁厚的增加,折射率传感灵敏度减小。图中, RIU(refractive index unit)表示单位折射率。

    Figure 6.  Refractive index sensing sensitivity of MTC with different wall thickness

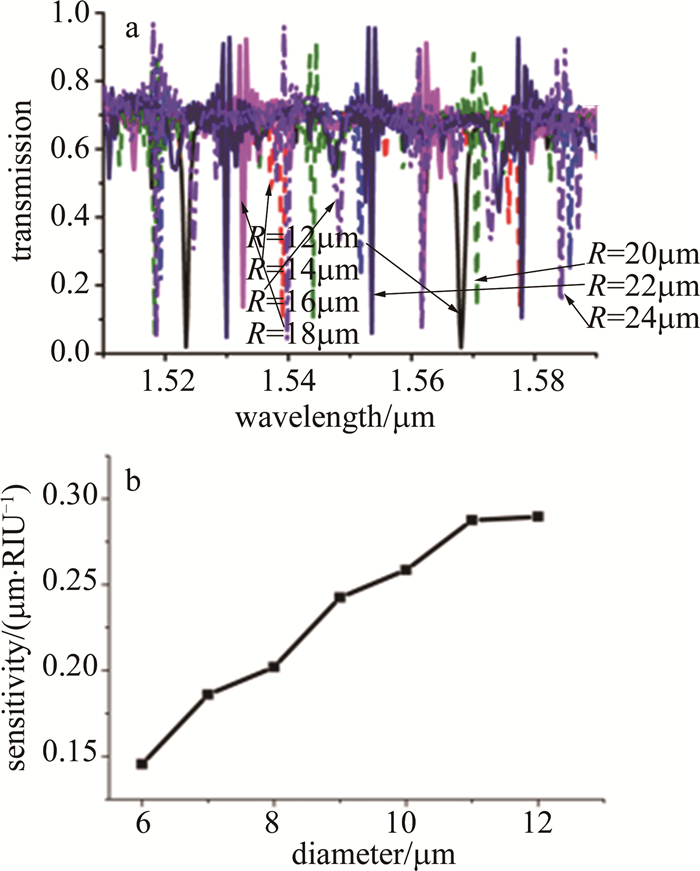
    取MTC的壁厚为0.8μm,锥形光纤的直径为1μm,二者耦合间距为0.4μm。保持其它参量值不变,向空心MTC中分别注入折射率为1.34和1.36的液芯。注入折射率1.36的液芯,共振波长相较于折射率1.34的液芯发生红移。如图 7所示,随着液芯MTC直径的增大,WGM共振谱发生红移,且共振波长漂移量会逐渐增大。因而折射率传感灵敏度随着液芯MTC的直径增大而增大。

2.   传感器实验系统
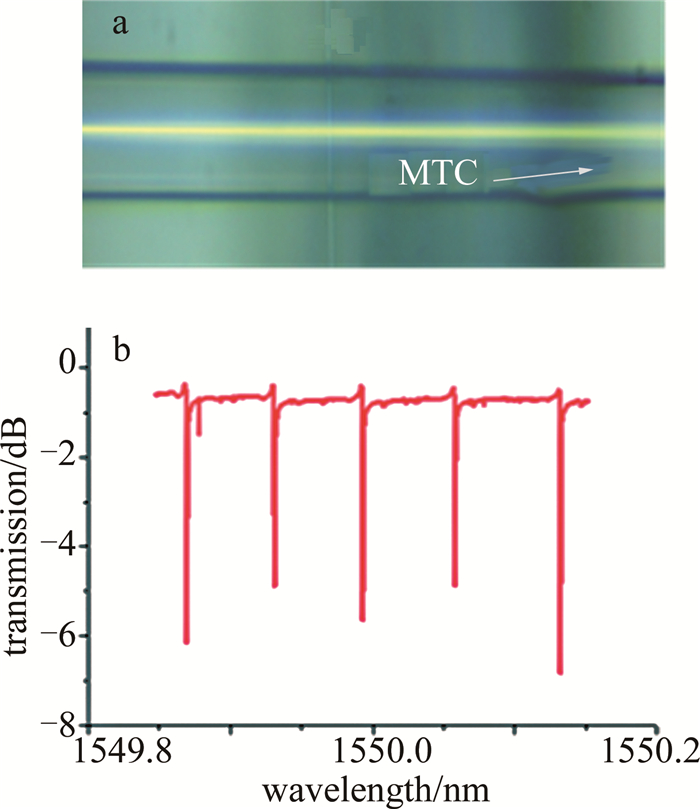
  • MTC和锥形光纤耦合的显微图像如图 8所示。作者使用熔融拉锥法实验制备了外径约为89.1μm的MTC,并通过管内气压控制法将MTC的壁厚拉伸到约2.5μm。通过锥形光纤与柱状微腔耦合激发WGM,测得MTC的Q因子约为1.1×10⁶。MTC和锥形光纤(锥区直径约为2μm~3μm)之间的耦合距离由精度为20nm的高精度电控位移平台控制。过耦合用于确保整个传感系统的稳定性。MTC可以将WGM特性与其微流控的固有能力相结合,并且Q因子相对较高,MTC的管壁薄而弯曲,具有大表面积,可以增强光与物质的互作用。所有这些都有助于在小范围内有效激发强的倏逝场,并有助于实现葡萄糖浓度测试的低检测极限和高灵敏度检测。

    Figure 8.  a—microscope photos of MTC-tapered fiber coupling system b—WGM spectrum test results with Q value of 1.1×10⁶

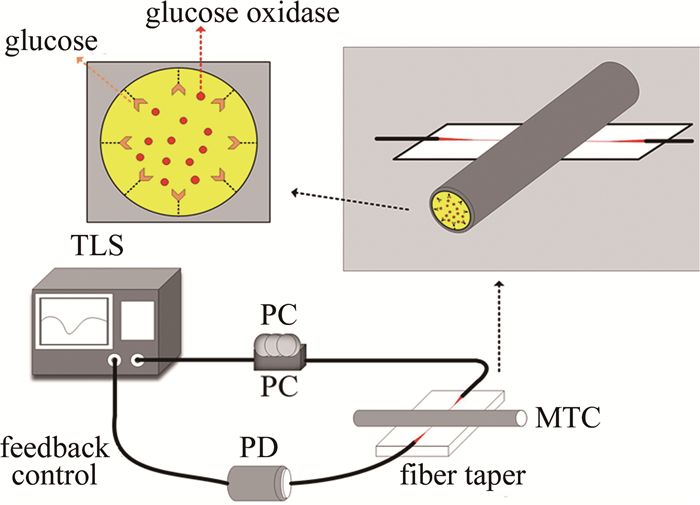
    基于MTC的葡萄糖浓度生物光学传感器实验装置如图 9所示。使用蠕动泵将葡萄糖溶液注入MTC(型号TJ-3A,蠕动泵的最小流速为7μL/min)。调谐光源中心波长为1550nm,线宽小于5kHz,调谐范围为35GHz。通过锥形光纤耦合MTC激发WGM共振谱,并由光电探测器(photoelectric detector, PD)接收,其带宽为125MHz, 由偏振控制器(polarization controller,PC)控制入射光的偏振状态。

    Figure 9.  Schematic diagram of glucose concentration bio-optical sensor experimental setup based on MTC

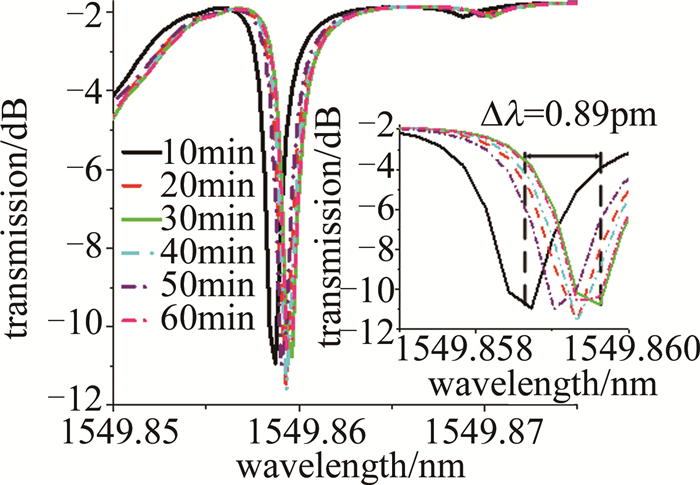
  • 采用过耦合方式实现微腔与锥形光纤的耦合,确保MTC耦合系统的稳定性。首先,将去离子水泵入MTC,测试传感器的稳定性,实验结果如图 10所示。每10min记录一次MTC的WGM光谱, 并连续测量1h。WGM光谱的最大波长漂移约为0.89pm。MTC中的WGM共振不仅对目标分析物敏感,而且对环境干扰(例如机械振动和温度变化)敏感。对于可检测的目标分析物变化,WGM光谱的波长偏移应大于0.89pm。传感系统放置在隔振光学平台上,温度扰动是潜在的噪声源,应考虑进一步改进以抑制传感器的不稳定。

    Figure 10.  WGM spectra of cylindrical microcavities measured within 1h(inset: enlarged view of WGM spectrum)

    将具有5种不同质量分数的NaCl溶液泵入柱状微管腔中。溶液折射率测试结果如表 1所示,每种溶液的折射率(refractive index, RI)用阿贝折射仪测量5次取平均值。

    mass fraction 1st 2nd 3rd 4th 5th average RI
    0.026 1.3375 1.3374 1.3374 1.3374 1.3373 1.3374
    0.028 1.3375 1.3376 1.3376 1.3378 1.3376 1.3376
    0.030 1.3380 1.3381 1.3382 1.3381 1.3382 1.3381
    0.032 1.3384 1.3384 1.3385 1.3385 1.3384 1.3384
    0.034 1.3390 1.3388 1.3389 1.3386 1.3388 1.3388

    Table 1.  The refractive index of five different concentrations of NaCl solution was measured five times each time

    保持锥形光纤-MTC的耦合条件稳定且不变, 逐步将质量分数为0.026,0.028,0.030,0.032,0.034的NaCl溶液泵入MTC,WGM光谱的对比结果如图 11所示。可以看出,随着泵入的NaCl质量分数的增加,WGM光谱会发生红移,因为溶液折射率的增加导致WGM谐振波长向长波长方向漂移。图 11b为测得的WGM波长偏移与NaCl溶液的折射率变化的关系。经计算MTC的体折射率灵敏度为23.36nm/RIU。

    Figure 11.  MTC with the increase of NaCl concentration

3.   低浓度葡萄糖测试实验结果与分析
  • 结合微流控方法将被测液态分析物进入MTC时,分析物与MTC内表面的交联可被视为光传播的1阶扰动,可计算出传播常数的变化:

    式中,Δβ表示传播常数的变化, 下标b表示生物分子与微腔表面综合处, σp是生物分子的表面密度,εs是相对介电常数,αex表示由于单个生物分子引起的过量极化,τ表示MTC表面功能化后内壁表面附近的场强变化,其大小与折射率和薄壁的厚度有关, E(x, y)表示电场强度,L代表传感区域长度。分母的积分表示整个波导截面上的模能量,由于大多数能量都限制在MTC内壁中,因此两种模式(光纤模式和混合模式)的积分振幅几乎相同;分子的积分表示MTC的内壁表面的能量密度,对(1)式进行变式可以获得:

    (2) 式说明了光场在微腔内传播常数的变化可引起WGM波长的漂移。在MTC内壁上捕获更多的葡萄糖分子会导致更大的折射率变化,从而WGM波长偏移量增加。因此,通过对MTC的表面功能化以增强对葡萄糖分子的捕获,可以提高灵敏度。

    实验过程中,利用葡萄糖氧化酶(glucose oxidase, GOD)对MTC的内壁进行表面功能化以捕获更多的葡萄糖分子。表面功能化所需的生化试剂为:去离子水、醋酸钠试剂、无水乙醇、无水葡萄糖、GOD、硝酸、浓硫酸和过氧化氢。

    表面功能化步骤如下:(1)将去离子水多次泵入MTC中,以确保MTC清洁,再注入质量分数为0.05的稀硝酸并密封在MTC中,静置2.5h;(2)用去离子水和酒精交替清洁MTC, 注入食人鱼溶液浓硫酸溶液并在MTC中密封1h,以确保MTC内壁表面上的羟基被完全活化; (3)将MTC保持中空并在室温下干燥,然后将3-氨基丙基三乙氧基硅烷溶液泵入MTC,并静置30min,再用去离子水和酒精冲洗以除去腔室的非共价键合的硅烷化合物; (4)将10mg/mL葡萄糖氧化酶(GOD)溶液(溶剂为乙酸钠缓冲溶液)注入MTC中, 将该MTC静置2h, 以确保在MTC的内表面盐化后,GOD-COOH基团与NH3+充分反应; (5)依次用乙酸钠缓冲溶液和去离子水冲洗MTC的内部,然后使其干燥。在表面功能化过程中重要的是,保持MTC和锥形光纤耦合的稳定性。

    由于实验制备的MTC具有较小的管径,结合微流控技术,实际实验测试用到的样品量可低至90nL。实验结果如图 12所示,随着葡萄糖溶液的浓度增加,测得的WGM光谱红移更大。从图 12a中可以看出,可检测到由2.65mmol/L的低葡萄糖浓度变化引起大约为3.04pm的波长偏移。葡萄糖浓度由0mmol/L变化到13.76mmol/L时,WGM共振波长从1547.122nm移至1547.139nm, 光谱位移范围达到13.76pm。图 12b中给出了波长偏移与葡萄糖浓度的函数线性拟合结果,表面功能化的MTC测试葡萄糖浓度具有较高的线性度,且其灵敏度约为0.911pm/(mmol/L)。

    Figure 12.  Results of glucose concentration tests

4.   结论
  • 提出了一种基于液芯MTC的低浓度血液葡萄糖光学传感器。基于FDTD算法仿真分析了MTC的尺寸结构参量对耦合条件和液芯折射率传感特性的影响。实验制备了外径约为89.1μm,壁厚约为2.5μm的MTC。通过锥形光纤与柱状微腔耦合激发WGM,测得MTC的Q因子约为1.1×10⁶。通过表面功能化方法增强MTC的葡萄糖测试灵敏度,可实现的线性度为0.988,检测灵敏度为0.911pm/(mmol/L),最小可检测葡萄糖摩尔浓度为2.65mmol/L,检测样液体积约为90nL。

    本文中提出的基于MTC的低浓度血液葡萄糖光学传感器具有高稳定性、低样本体积、快速检测以及高成本效益的优点,在运动员耐力训练中血糖的实时、快速监测,保障运动安全性和持久性等具有重要的实用价值。

Reference (21)

Catalog

    /

    DownLoad:  Full-Size Img  PowerPoint
    Return
    Return