 Map
Map


HTML
-
随着电脑的普及,人们的书写习惯已经逐渐由传统的手写转变为打印、复印。各种案件中打印或复印文件成为常出现的物证之一。通过对打印、复印墨粉成分进行分析,区分出不同品牌的墨粉,能为公安机关侦破案件提供有效线索[1]。
通常打印机所使用的墨粉是以荷电添加剂、染料、树脂等成分为原料的复合产物[2]。不同的生产厂家采用不同的生产方式,使用不同的树脂、染料、载体、荷电添加剂,导致不同品牌的墨粉在成分上存在差异,故可作为区分鉴别激光打印机打印文件的重要依据[3]。
目前,用来鉴别激光打印/复印墨粉成分的方法主要有喇曼光谱法[4]、扫描电镜/能谱法[5]、红外光谱技术[6]、裂解气相色谱/质谱连用(pyrolysis gas chromatography mass spectroscopy,Py-GC/MS)法[7]等。喇曼光谱法因其所需样品量小而广泛应用于微量物证领域。但喇曼信号易受荧光干扰且灵敏度较低。在对有机化合物进行鉴定时,红外光谱法优势显著,但样品制备较为复杂。扫描电镜/能谱法作为联用技术,定性结果准确,但操作更为复杂。裂解气相色谱/质谱联用法则比较耗时。而X射线荧光光谱法具有样品制备简单,操作便利,分析速度快,且能同时分析复杂样本中多种元素的优点。因其对轻元素的检测具有局限性,目前对墨粉的检测中大多用于测定墨粉中重金属含量[8], 将其应用于法庭科学中不同品牌墨粉的鉴别则是一种较为新颖的思路。
聚类分析是通过比较各数据源的相似程度,并将数据源分类到不同的簇中。优化k均值(power k-means)聚类分析[9]针对普通k均值算法初值敏感进行优化,既削弱了初值对聚类结果的干扰,同时提高了算法的高维度表现,并且维度越高其优势更为明显。
-
X-MET7000e能量散射型X射线荧光光谱仪(英国Oxford牛津仪器),Rh为阳极靶;电压40kV,电流60μA。测试时间110s。
-
不同品牌、厂家的常见打印、复印墨粉样本28个(样品表略)。
-
测定最优实验时间为110s后进行重现性实验,确证实验在110s时具有良好的重现性,故以之为最优测定时间。
使用脱脂棉蘸取酒精擦拭样品盒后,依此将墨粉放入样品盒中,封膜,测定。其结果见表 1。
sample number source brand origin main element content/(μg·mg-1) Fe Ti Cr Ca Mn Zn Sr Co Sn Ba Ni Cu 1# ICE COLOR import 63.131 0.036 1.492 0.326 0.451 0.070 0.000 0.000 0.000 0.000 0.013 0.000 2# PRINT-RITE Guangzhou 0.962 0.000 0.001 0.457 0.000 0.027 0.000 0.000 0.000 0.000 0.000 0.000 3# JANTMY import 1.427 0.000 0.000 0.481 0.000 0.457 0.000 0.000 0.000 0.000 0.013 0.000 4# onE ZHonG Zhuhai 11.161 0.023 0.000 0.404 0.000 0.020 0.000 0.000 0.000 0.000 0.000 0.000 5# CHG Zhuhai 548.116 1.719 0.479 0.264 2.443 0.198 0.652 0.370 0.103 0.129 0.000 0.000 6# YI YIN Shenzhen 14.324 8.298 0.000 2.971 0.000 0.052 0.088 0.000 0.000 0.000 0.000 0.000 7# LEDS Changping 3.234 0.056 0.000 0.544 0.000 0.013 0.016 0.000 0.000 0.000 0.000 0.000 8# JCS Luzhou 551.073 3.918 0.565 0.341 1.624 0.170 0.019 0.350 0.082 0.000 0.025 0.000 9# KILTLER Haidian 79.118 15.394 5.046 0.362 0.782 0.027 0.026 0.000 0.000 0.000 0.012 0.000 10# LEDS import 10.281 0.200 1.250 0.365 0.560 1.130 0.000 0.000 0.000 0.000 0.016 0.000 11# LS Baoding 560.750 0.639 0.281 0.361 1.744 0.102 0.721 0.494 0.084 0.000 0.034 0.000 12# OAREN import 49.075 11.469 0.083 0.957 0.277 0.249 3.456 0.000 0.145 0.000 0.013 0.000 13# FUJI-XEROX Minhang 273.737 5.272 3.276 0.956 28.338 11.815 0.468 0.069 0.058 0.113 0.855 10.132 14# YI YIN Zhuhai 5.490 1.228 0.010 1.119 0.000 0.014 0.150 0.000 0.000 0.000 0.000 0.000 15# HAO YI DIAN Zhuhai 133.323 0.595 0.049 0.000 0.723 0.033 0.499 0.000 0.000 0.000 0.000 0.000 16# JIA JI Dezhou 1.839 43.565 1.886 0.635 0.215 0.000 10.852 0.000 0.000 0.138 0.000 0.231 17# GGIMAGE Zhuhai 506.202 3.923 1.032 0.309 1.686 0.170 6.555 0.189 0.069 0.000 0.035 0.000 18# OAREN Changping 44.814 17.375 0.088 7.521 0.225 0.434 1.215 0.000 0.037 0.155 0.015 0.010 19# HUI MEI import 4.115 17.226 0.000 0.718 0.000 0.448 0.315 0.000 0.000 0.149 0.000 0.000 20# DAYS OF GEN Huzhou 540.007 4.273 1.134 0.402 2.561 0.221 8.486 0.547 0.096 0.194 0.000 0.000 21# JANTMY Zhuhai 25.772 0.030 0.013 0.456 0.128 0.086 0.000 0.000 0.000 0.000 0.000 0.000 22# PRINT-RITE Zhuhai 35.787 0.023 1.489 0.382 0.292 0.047 0.000 0.000 0.000 0.000 0.000 0.000 23# ICE COLOR Shenzhen 108.484 0.081 1.298 0.349 0.521 0.342 0.000 0.000 0.036 0.000 0.010 0.000 24# RUIBANG Xicheng 528.655 0.781 0.829 0.486 2.072 0.189 0.360 0.350 0.064 0.000 0.023 0.000 25# DAYS OF GEN Huzhou 4.285 0.000 0.284 0.479 0.000 0.014 0.000 0.000 0.000 0.000 0.000 0.000 26# BEFon Yiwu 505.603 7.372 1.133 1.224 1.808 0.393 12.984 0.431 0.092 0.233 0.021 0.000 27# KABLEE Changping 16.327 0.000 0.913 0.450 0.143 0.023 0.000 0.000 0.000 0.000 0.000 0.000 28# GAO XIN Haidian 375.771 0.173 0.586 2.278 1.134 0.218 0.701 0.117 0.087 0.000 0.057 0.169 Table 1. The results of detection
1.1. 实验设备
1.2. 实验样本
1.3. 实验过程
-
由表 1可知,Fe, Ti, Cr, Ca, Mn, Zn这6种元素几乎存在于所有样本中,而含有Co, Sn, Ba, Cu 4种元素的样本数量则较少,故上述10种元素的有无对初步分类价值较低,但其含量可以作为进一步分组的依据。因此选用Sr和Ni两种元素的有无对28种样本进行初步分类,可划分为4类,如表 2所示。其中,“+”代表“含有”;“-”代表“不含”。
type number Ni Sr sample number 1 + + 8#, 9#, 11#, 12#, 13#, 16#, 17#, 18#, 19#, 24#, 26#, 28# 2 + - 1#, 2#, 3#, 10#, 21#, 22#, 23# 3 - + 5#, 6#, 7#, 14#, 15#, 20# 4 - - 4#, 25#, 27# Table 2. The classification results according to element composition
-
1类的12个样本,2类的7个样本和3类的6个样本单纯依赖人工分析,难以准确地以12种元素含量为变量将其进一步分组,得到可靠的分组结果,故而采用R语言[10],先利用肘方法[11]确定出最优簇的数目,再运用优化k均值算法以1~3类样本的12种可稳定检出的元素含量为变量分别进行聚类分析,获得深入分组结果,最后采用矩积相关系数[12]验证分组结果的可靠性。
-
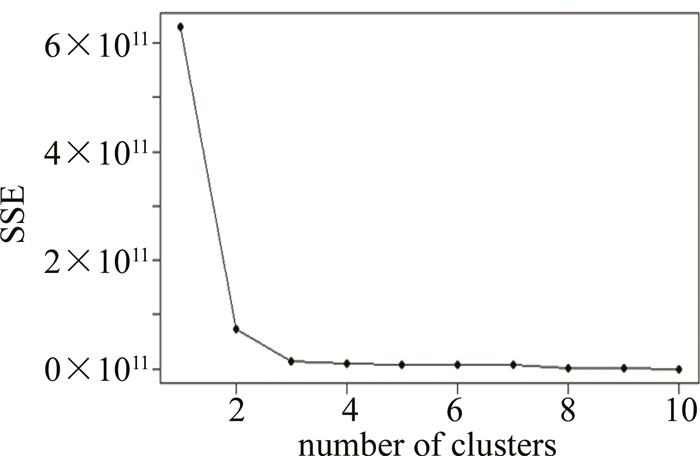
在实现聚类算法时需要预设一个k值,即将数据源分为k个类别,k值的确定影响整个算法。在k值接近于真实值时,误差平方和(sum of squares due to error,SSE)的斜率会发生骤变,从而在图像上形成一个“肘部”,该拐点即为真实的k值。其中SSE可以作为评价聚类结果好坏的标准[13]。
运用R语言来确定真实k值,以1类为例,如图 1所示。折线在簇的数目为2时由陡直变为平缓,故而可以确定k=2。依此方法依此可得2类、3类的k值亦为2。

Figure 1. The first group inflection point graph
-
经典的k均值算法进行聚类分析时有着简单高效的优点[12],但是该种方法对初值十分敏感,倘若初值选择不当,将会导致聚类结果无效。并且当数据维度非常高时,计算速度则会明显下降。而优化k均值聚类分析能够提升高维度表现力并且弱化对初值的要求[14]。
经典k均值算法是一种无监督分类算法,使用贪心策略,多重迭代求得近似解。其目标函数如下式所示:
式中,k为簇的个数,xi为第i个样本点,θj为第j个簇心。每次迭代,通过最小化欧几里得距离‖xi-θj‖将每个样本点xi分配到指定簇Ci。k均值算法得到的聚类结果比较依赖于簇心的初始值选择,如果初始化不好,则可能仅得到局部最优解。
优化k均值算法在形成簇心的过程中使用加权算法,其目标函数如下:
式中,s为控制系数,Ms(y1,y2, …, yk)为借助连续且严格单调的指数函数g(y)取柯尔莫戈洛夫均值:
具体聚类步骤如下:
(1) 在样本中随机选取k个样本点充当初始聚集各个簇的中心点,选择控制系数s的值。
(2) 通过距离,计算第i个样本对第j个簇心的权重ωij,其中:
(3) 计算完所有样本点对所有簇心的权重后,更新新的第j个簇心θj,其中:
(4) 反复迭代第(2)步和第(3)步直至收敛。
优化k均值算法在保持了原k均值算法的简洁和时间复杂性的同时, 降低了对簇心初值的依赖性。
-
借助肘方法获得的k值,分别使用优化k均值聚类分析对1~3类内的样本进一步分类,将每一大组又分别分为两小组,共将28个样本分为7组,分组结果如表 3所示。
type number group number sample number 1 1-1 8#,11#,17#,24#,26#,28# 1-2 9#,12#,3#,16#,18#,19# 2 2-1 2#,3#,21#,22# 2-2 1#,10#,23# 3 3-1 6#,7#,14#,15# 3-2 5#,20# 4 4 4#,25#,27# Table 3. The classification results of power k-means
-
为验证分组结果的有效性,计算组内数据的矩积相关系数。矩积相关系数用以描述两个定距变量间联系的紧密程度,当矩积相关系数越接近1时,表明两个变量相关度越高。随机抽取1#样本,选取2-2组组内样本,各组内抽取1个组间样本,计算矩积相关系数。结果如表 4所示,1#样本与同一组内的10#、23#样本相关度均在0.001水平上呈显著相关[15],与组间样本的矩积相关系数小于组内样本,表明分组结果较为理想。
-
聚类分析法分组结果中,3#、21#这两个简特美(JANTMY)的样本均在2-1组,1#、23#这两个冰彩(ICE COLOR)的样本均在2-2组,穗彩(OAREN)、佳彩(JCS)、颐印(YI YIN)样本亦与本品牌样本归为一类,没有同一品牌的样本被分为不同组。由此可知,上述5种品牌的打印、复印墨粉在元素的种类及含量上具备较强的同源性。领盛(LEDS)品牌的两个样本被分在不同组别中,可能由于产地不同所致。其余不同品牌的样本,也可因墨粉元素含量的差异而被区别成若干组别。
sample number correlation coefficient group number 2# 0.8977 2-1 3# 0.9059 2-1 4# 0.9991 4 5# 0.9997 3-2 6# 0.8415 3-1 8# 0.9997 1-1 9# 0.9809 1-2 10# 0.9998 2-2 23# 0.9999 2-2 Table 4. The correlation coefficient of sample 1#
以所含样本数量最多的1-1组为例,根据Ti/Cr值的大小可以继续划分为3组,如表 5所示。再以1-1-1组为例,24#样本Ca/Mn值为12.20,28#样本Ca/Mn值为1.99,差距较大,所以根据Ca/Mn值的大小能将组内2种样本区分开来。依照该方法,根据元素含量比值的差异可以分别将7组样本继续分组,能够达到对打印、复印墨粉细化区分目的。
group number Ti/Cr domain sample number 1-1-1 Ti/Cr≤1 24#, 28# 1-1-2 1 < Ti/Cr < 5 17#, 18# 1-1-3 Ti/Cr≥5 8#, 26# Table 5. The classification results based on Ti/Cr
2.1. 根据元素成分进行分类
2.2. 使用聚类分析法进行分组
2.2.1. 数据分析
2.2.2. 最优簇数目的确定
2.2.3. 优化k均值聚类分析
2.2.4. 分组结果
2.3. 聚类效果验证与结果分析
2.3.1. 聚类效果评估
2.3.2. 结果分析
-
首先采用X射线荧光光谱法对墨粉样本的金属元素含量进行测定。而后依据元素成分的不同进行分类,又通过聚类分析法进一步分组,经矩积系数验证后证明,该分组方法科学有效,且分组后各组数据特征明显,能够达到一定程度上区分不同品牌打印、复印墨粉的目的。构建了一种快速、无损对墨粉检材进行鉴别的模型,分组效果理想,为司法鉴定墨粉物证提供了思路。
 DownLoad: