Advanced Search

ISSN1001-3806 CN51-1125/TN Map

Volume 46 Issue 1
Jan.  2022
Article Contents
Turn off MathJax

Citation:

Study on vegetation camouflage exposure in Relief-F screening band

  • Corresponding author: YANG Guang, yg2599@126.com
  • Received Date: 2020-12-30
    Accepted Date: 2021-03-10
  • In order to quickly expose vegetation camouflage and transform the hyperspectral research problem into the multi-spectral application problem, the hyperspectral band was selected based on the Relief-F algorithm was selected for the study of vegetation camouflage. First, the common plant spruce was used to simulate vegetation camouflage targets, and the HH2 ground-object spectrometer was used to collect experimental data. Then, the author introduced the Relief-F algorithm to screen the subset of feature bands, and conducted classification experiments with the subset of band obtained by other two common algorithms.The results show that the classification accuracy of using the Relief-F algorithm to choose the feature band subset is up to 96.4%, which is higher than the other two algorithms. This research is helpful for exposing the camouflage problem of vegetation.
  • 加载中
  • [1]

    ZHANG B, GAO L R. Hyperspectral image classification and target detection[M]. Beijing: Science Press, 2011: 1-20(in Chinese).
    [2]

    YANG Zh J. Introduction to camouflage stealth technology for military targets[M]. Beijing: National Defense Industry Press, 2014: 15-31(in Chinese).
    [3]

    MA Y P, ZHANG W, LIU D X. Characteristics of hyperspectral reconnaissance and threat to ground military targets[J]. Aerospace Shanghai, 2012, 29(1): 37-41(in Chinese).
    [4]

    LIU Zh M, HU B R, WU W J. Spectral imaging of green coating camouflage under hyperspectral detection[J]. Acta Photonica Sinica, 2009, 38(4): 885-890(in Chinese).
    [5]

    WEI Zh T, HUANG J, FANG Q. Vegetation camouflage assessment based on analysis of characteristics of vegetative landscape[J]. Journal of PLA University of Science and Technology(Natural Science Edition), 2014, 15(1): 51-55(in Chinese).
    [6]

    HUGHES G. On the mean accuracy of statistical pattern recognizers[J]. IEEE Transactions on Information Theory, 1968, 14(1): 55-63. doi: 10.1109/TIT.1968.1054102
    [7]

    ZHANG L, SHAO Zh F. Hyperspectral remote sensing image classification based on improved OIF and SVM algorithm[J]. Science of Surveying and Mapping, 2014, 39(11): 114-117(in Chinese).
    [8]

    WANG Q, YANG G, XIANG Y J. Band selection method of hyperspectral image based on subspace partition[J]. Ship Electronic Engineering, 2017, 37(4): 98-102(in Chinese).
    [9]

    WANG Q H, HUA W Sh, HUANG F Y. Hyperspectral anomaly detection algorithm based on spectral angle background purification[J]. Laser Technology, 2020, 44(5): 623-627(in Chinese).
    [10]

    YAN Y, HUA W Sh, ZHANG Y. An improved method of hyperspectral endmember extraction based on band selection[J]. Laser Technology, 2019, 43(4): 574-578(in Chinese).
    [11]

    CHEN Zh K, GUO R, CHENG P F. Application of LIF technology-based spectral feature extraction in oil detection[J]. Laser & Optoelectronics Progress, 2020, 57(13): 133002(in Chinese).
    [12]

    HE Y, WANG J F. Rapid nondestructive identification of wood lacquer using raman spectroscopy basedon characteristic-band-fisher-k nearest neighbor[J]. Laser & Optoelectronics Progress, 2020, 57(1): 013001(in Chinese).
    [13]

    KIRA K, RENDELL L A. The feature selection problem: Traditional methods and a new algorithm[C]//Proceedings of 10th National Conference on Artificial Intelligence. New York, USA: IEEE, 1992: 129-134.
    [14]

    HUANG X J. Relief-based feature selection algorithms[D]. Suzhou: Soochow University, 2018: 81-92(in Chinese).
    [15]

    KONONENKO I. Estimating attributes: Analysis and extensions of Relief[C]//Machine Learning ECML-94. New York, USA: IEEE, 1994: 171-182.
  • 加载中
通讯作者: 陈斌, bchen63@163.com
  • 1. 

    沈阳化工大学材料科学与工程学院 沈阳 110142

  1. 本站搜索
  2. 百度学术搜索
  3. 万方数据库搜索
  4. CNKI搜索

Figures(2) / Tables(4)

Article views(3706) PDF downloads(17) Cited by()

Proportional views

Study on vegetation camouflage exposure in Relief-F screening band

    Corresponding author: YANG Guang, yg2599@126.com
  • 1. Air Force Aviation University, Changchun 130022, China
  • 2. 31434 Unit, People's Liberation Anmy of China, Shenyang 110000, China

Abstract: In order to quickly expose vegetation camouflage and transform the hyperspectral research problem into the multi-spectral application problem, the hyperspectral band was selected based on the Relief-F algorithm was selected for the study of vegetation camouflage. First, the common plant spruce was used to simulate vegetation camouflage targets, and the HH2 ground-object spectrometer was used to collect experimental data. Then, the author introduced the Relief-F algorithm to screen the subset of feature bands, and conducted classification experiments with the subset of band obtained by other two common algorithms.The results show that the classification accuracy of using the Relief-F algorithm to choose the feature band subset is up to 96.4%, which is higher than the other two algorithms. This research is helpful for exposing the camouflage problem of vegetation.

引言
  • 军事行动的隐蔽性要求行动时必须借助一定手段进行伪装[1]。在军事领域上,伪装的目的是通过减少目标与背景的差异性,使观察者难以发现目标[2],因此,伪装效果决定着军事行动的隐蔽性。传统的侦察手段主要依靠可见光传感器,而针对这种侦察手段的伪装,主要依靠改变目标的色调实现伪装效果[3]。高光谱图像能同时获取地物的2维空间图像和一定波长范围内的光谱曲线,不同物体在光谱特征上存在差异,利用这一点可以实现揭露目标伪装[4]

    植被伪装是通过采集目标周围植物对军事目标进行遮障、覆盖以达到隐蔽目标的一种手段,伪装目标与周围环境在色调、形态,甚至是光谱特征上都具有极高相似性,因此具有优良的伪装效果[5]。植被伪装由于水分和叶绿素的减少会与周围植被环境在一定波段范围内产生差异,这种细微的差异是揭露伪装的关键。高光谱图像包含数百个波段的光谱数据,在实际应用过程中计算量巨大;且相邻波段数据相关性强,容易造成“维数灾难”[6],导致分类精度降低,所以必须对高光谱图像进行降维。为了保留数据的原始物理意义,采用波段选择算法进行降维。典型算法包括最佳指数法[7]、子空间划分[8]等。为了识别出特定目标,采用异常检测算法,如基于光谱角背景纯化局部异常检测算法[9]、改进波段选择方式提取端元[10]、基于特征波段进行鉴别[11]、基于激光诱导荧光技术提取特征光谱[12]等方法。但是这些算法仅从与数据本身相关的固有属性入手,难以结合具体实际问题进行波段选择。

    针对上述问题,作者提出基于过滤式特征选择扩展(relevant feature, Relief-F)算法进行高光谱波段选择,用于进行揭露植被伪装问题的研究。通过模拟一个植被伪装目标作为研究对象,分析不同时间段下伪装目标光谱特征的变化。一方面通过观察光谱数据,定性分析变化较大的波段范围及变化幅度;另一方面,引入Relief-F算法分析伪装目标与周围环境的光谱波段的差异性,结合子空间划分的思想进行波段选择。最后与传统的波段选择方法进行对比,验证Relief-F算法在这一问题上的有效性。

1.   实验
  • 植被伪装一般是通过将采集的植物覆盖在目标上来进行伪装,所以用于伪装目标的植物会随着时间的推移和环境的变化逐渐枯萎,水分和叶绿素逐渐减少,这个过程从植物被采集下来便开始了。因此,准确获得植物在枯萎过程中变化敏感的波段区间是作者研究的核心目的。

  • 实验于2020-07开展,以云杉这种常见的植物作为材料。由于植被伪装的伪装材料一般与周围环境的主要植被相同,所以采用云杉的叶作为模拟植被伪装的原材料。首先在12:00采集云杉叶若干,确保采集的样本能够接受到充足日照;然后使用云杉叶样本分别设置3个植被伪装目标,确保伪装材料将地面目标完全覆盖,将伪装目标放置在无遮障的自然环境下。

  • 本实验中采用ASD公司生产的Hand Held 2(HH2)便携式地物光谱仪进行数据采集,光谱波长范围为325nm~1075nm,波长精度±1nm,光谱分辨率小于3.0nm。分别对新鲜采集的植物样本、在自然环境下放置24h, 48h和72h的3个伪装目标进行光谱数据采样,对每一种样本采集50个样本数据,共200个光谱数据,如表 1所示。

    spectral data collection sample number of collected data/piece
    vegetation environment
    (freshly collected spruce leaf samples)
    50
    vegetation camouflage 1
    (spruce leaf samples collected 24h later)
    50
    vegetation camouflage 2
    (spruce leaf samples collected 48h later)
    50
    vegetation camouflage 3
    (spruce leaf samples collected 72h later)
    50

    Table 1.  Spectral data sampling table

    为了降低周围环境中散射光对光谱数据质量的影响,实验人员统一着深色服装。采集数据时,首先对光谱仪采集暗电流、定标,然后将仪器垂直向下对准目标,距离目标约1m,确保实验人员面向太阳,目标上无阴影。采集数据过程中,每经过10min,需要对光谱仪再次定标。

    光谱数据采集完成后,首先对光谱数据降噪,然后对采集到的数据转化为反射率,便于后续计算。

  • Relief算法是一种滤波式的特征选择算法,最早由KIRA和RENDELL提出用于二分类问题[13]。算法的核心思想是通过考察特征在同类近邻样本与异类近邻样本之间的差异来选择特征,权重小于某个阈值的特征将被移除[14]。后来,KONONENKO等人提出了Relief-F算法来处理多分类问题[15],将多分类问题转化成多个二分类问题,解决了多类别特征选择过程。Relief-F算法的计算过程简述如下。

    假设存在数据集D={(xi, yi)}, i=1, …, n,其中xi代表第i个样本,yi代表第i个样本标签。首先从数据集中随机选择一个样本xi,随后从该样本的同类样本中寻找k个距离最近样本Hi,其中|Hi|=k,从异类样本中寻找k个距离最近样本Mi,|Mi|=k。对于每一个样本xi定义一个平均间隔向量ρi:

    在得到每一个样本的平均间隔向量后,利用下式来更新特征权重向量w:

    式中, ‖·‖表示范数。连续迭代一定次数,最终得到各个特征的权重向量w

  • 本实验流程如下:(1)制作并放置伪装目标;(2)使用光谱仪在不同时间点采集植被伪装的光谱数据,并进行降噪和归一化预处理;(3)分析对比伪装目标与周围植被环境的光谱曲线,利用Relief-F算法计算伪装目标分别与周围环境的特征权重关系,并根据特征权重选择特征波段;(4)与其它常用的波段选择算法对比,利用k均值无监督分类算法进行对比实验。

2.   结果与分析
  • 图 1是对各类样本采集到的光谱数据。每一种样本的光谱曲线取50个样本数据平均值。

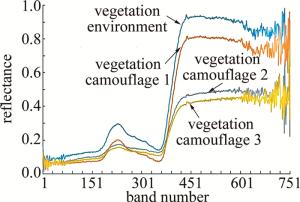
    Figure 1.  Spectral curves of various samples

    通过观察图 1可以发现,与刚采集的云杉叶相比,植被伪装的时间越长,在第130波段~第250波段以及第300波段~第500波段的光谱曲线变化程度越多,这两处波段范围对应的波长范围分别是455nm~575nm和625nm~825nm波长范围内,处于水吸收波段和红光及红外波段范围。这一范围正是植物的水吸收区和“红边”的两个区域,表明植被伪装的中植被的水分和叶绿素随着时间推移在不断减少,导致对应波段范围内的光谱曲线发生相应改变。同时观察图 1还可以发现,当云杉采集24h、48h和72h后,光谱特征的变化幅度不相同。从24h~48h这段时间,在455nm~575nm和625nm~825nm波长范围内的光谱特征变化幅度明显增大。综上所述,当利用植被伪装军事目标时,短时间内伪装效果比较好,长时间之后,伪装效果会迅速下降。

  • 利用Relief-F算法对植被环境、植被伪装1、植被伪装2和植被伪装3共4种样本的数据进行特征权重分析,如图 2所示。

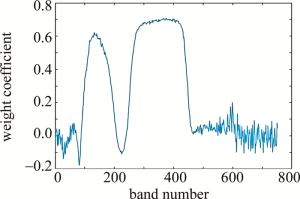
    Figure 2.  Weight coefficients of each band obtained by Relief-F algorithm

    图 2中可以看出, 在权重较高,对应点波长范围分别是425nm~525nm和575nm~785nm,与从图 1中观察所得结果略有出入,但总体上是相同的。波段的权重系数越高,说明植被环境与伪装目标之间在该波段内差异越大。其中单波段权重系数最高的是第432波段,对应的波长为767nm,波段位于“红边”位置。

    结合子空间划分的思想,从权重系数较高的2个波段区间第100波段~第200波段以及第250波段~第460波段内,按照权重系数的大小等比例选择波段,避免所选波段子集相关性过高。

  • 为了验证Relief-F在揭露植被伪装的性能,将Relief-F算法与常用的波段选择算法进行对比,常用的算法包括最佳指数法、自动子空间划分法。使用3种算法选择10个波段,波段选择结果如表 2所示。

    band selection method band subset
    optimum index factor 412,357,58,133,134,531,532,533,441,215
    auto subspace partition 67,68,69,70,133,134,135,136,137,138
    Relief-F 432,417,443,357,323,137,151,160,148,149

    Table 2.  Subset of bands selected by three algorithms

    验证3种波段选择算法所得的波段子集的分类精度,具体方法为:对所测200条光谱数据利用k均值算法进行无监督分类,将其分为植被环境、植被伪装1、植被伪装2和植被伪装3共4类,其中总体分类精度代表被正确分类的样本占所有样本数的比例。分类结果如表 3所示。

    optimum index factor/% auto subspace partition/% Relief-F/%
    vegetation environment 90.3 93.1 95.6
    vegetation camouflage 1 89.5 92.4 96.3
    vegetation camouflage 2 91.3 93.5 96.5
    vegetation camouflage 3 91.6 93.4 97.2
    overall classification similarity 90.4 93.1 96.4

    Table 3.  Classification accuracy of three algorithms

    表 3中的分类结果可以发现,利用Relief-F算法选择的特征波段分类精度高于其它两种算法,表明Relief-F提取到的特征波段子集在揭露植被伪装方面具有一定优越性。再利用余弦相似度将3种算法分类结果同地物真实分类标记结果比较,余弦值如表 4所示。值越接近于1,表明相似程度越高。

    optimum index factor auto subspace partition Relief-F
    vegetation environment 0.8742 0.9325 0.9534
    vegetation camouflage 1 0.8892 0.9367 0.9595
    vegetation camouflage 2 0.9031 0.9410 0.9778
    vegetation camouflage 3 0.9246 0.9462 0.9853
    overall classification similarity 0.8978 0.9391 0.9690

    Table 4.  Cosine similarity between the classification results of three algorithms and the real classification

    表 4中的余弦相似度可知,通过Relief-F算法比较波段权重系数选择的特征波段分类结果相似度比其它两种筛选波段的算法略高,说明该算法可以应用于揭露植被伪装的实践中。

3.   结论
  • 由于植被伪装在色调、形态以及光谱特征上与周围环境高度类似,所以揭露植被伪装较为困难。本文中利用常见植物模拟植被伪装目标,采集样本光谱数据进行实验分析;提出利用Relief-F算法结合子空间划分思想选择光谱数据特征波段,既考虑了光谱特征的类间可分性,又在一定程度上避免了波段子集相关性问题。与其它两种常用的波段选择方法对比,Relief-F算法所选波段子集在4种目标上的分类精度高于其它两种算法,总体分类精度达到了96.4%,余弦相似度达0.9690。证明利用Relief-F算法筛选的光谱波段可以有效地识别出不同时间段的植被伪装目标,在高光谱图像揭露植被伪装以及植被伪装目标的设置应用方面具有一定的价值。

Reference (15)

Catalog

    /

    DownLoad:  Full-Size Img  PowerPoint
    Return
    Return