 Map
Map


HTML
-
激光熔覆是通过聚集高能量激光束,使基材表面和熔覆材料融化,并快速凝固成型,在基体表面形成一层冶金结合涂层的技术[1-5]。在激光熔覆过程中,影响因素有很多,熔覆材料的选取,输出电流、脉冲宽度、扫描速率等工艺参数的设置,都会直接影响到熔覆层的宏观形貌以及质量[6-11]。
为了获得优良的熔覆层质量,XU等人[12]通过正交实验法,研究了激光工艺参数与熔覆层宽、高和稀释率之间的关系,认为对熔覆层宽、高及稀释率影响最重要的因素分别是激光功率、粉盘转速及激光功率。YU等人[13]基于正交法,研究了工艺参数对铁基熔覆涂层宽度、高度、深度的影响。HUANG等人[14]采用极差分析法,研究了激光工艺参数对涂层裂纹及厚度的影响。
以上研究主要利用正交设计方法研究了激光工艺参数对熔覆涂层的影响,可以找出多个因素水平的最优组合,但是只能分析离散型数据。现有的研究通过各种方法所构建的模型具有一定的局限性,无法适用于激光熔覆铁基TiC复合涂层的实际情况,且有关工艺参数及其组合参数对激光熔覆铁基TiC复合涂层质量的研究较少。响应面法是一种综合试验设计和数学建模的优化方法,能够明确地获得影响因素与响应目标之间的函数关系[15-20]。因此,本文中采用YAG激光器,在60Si2Mn基体上制备铁基TiC复合涂层, 通过响应面法,研究不同工艺参数对熔覆层几何参数、宽高比、稀释率、硬度的影响,并进行参数优化确定最佳工艺参数组合,实现了对熔覆层质量的有效控制。
-
此次实验是基于响应面软件Design-Expert操作界面下的Box-Behnken design(BBD)设计试验方案,并构建响应面数学模型。实验中选用输出电流X1、脉冲宽度X2和扫描速率X3这3个激光熔覆工艺参数作为影响因素,每个优化因素设置为3个水平, 以-1, 0, +1对因素水平进行编码(如表 1所示),其中0对应的是影响因素的中心值,而-1, +1分别代表影响因素的低值、高值。选取熔覆层宽度W、高度H、熔池的深度h、稀释率η、宽高比(W/H)和熔覆层的显微硬度HV作为响应目标。设计出15组激光熔覆工艺参数复合实验,如表 2所示。
level of factor -1 0 +1 X1/A 135 150 165 X2/ms 2.5 3.0 3.5 X3/(mm·min-1) 250 300 350 Table 1. Laser cladding process parameters and factor levels
standard order factors responses X1/A X2/ms X3/(mm·min-1) W/mm H/mm h/mm W/H η/% HV/HV0.2 1# 135 2.5 300 1.83 0.58 0.07 3.16 10.77 643.8 2# 165 2.5 300 2.46 0.51 0.12 4.82 19.05 749.8 3# 135 3.5 300 2.29 0.77 0.1 2.97 11.49 657 4# 165 3.5 300 2.69 0.5 0.22 5.38 30.56 736.3 5# 135 3 250 2.33 0.79 0.07 2.95 8.14 673.3 6# 165 3 250 2.83 0.55 0.19 5.15 25.68 718.6 7# 135 3 350 2.02 0.69 0.08 2.93 10.39 686.8 8# 165 3 350 2.44 0.58 0.19 4.21 24.68 756 9# 150 2.5 250 2.21 0.66 0.09 3.35 12 649.8 10# 150 3.5 250 2.6 0.83 0.2 3.13 19.42 712.9 11# 150 2.5 350 1.78 0.66 0.1 2.7 13.16 707.8 12# 150 3.5 350 2.22 0.82 0.17 2.71 17.17 717.5 13# 150 3 300 2.37 0.77 0.12 3.08 13.48 729.5 14# 150 3 300 2.28 0.79 0.14 2.89 15.05 742.8 15# 150 3 300 2.29 0.78 0.18 2.94 18.75 725.5 Table 2. Box-Behnken design test scheme and results
-
实验中选用以60Si2Mn弹簧钢为基体材料,试样尺寸为40mm(长度)×20mm(宽度)×2mm(厚度)。熔覆材料选择Fe60粉末与TiC(纯度99.98%)混合而成的复合粉末,质量比为9∶1,表 3为Fe60化学成分表。
specification C Si Cr Mn Fe Fe60 ≤0.0002 ≤0.01 0.14~0.18 ≤0.004 balance Table 3. Chemical content of Fe60 powder(mass fraction)
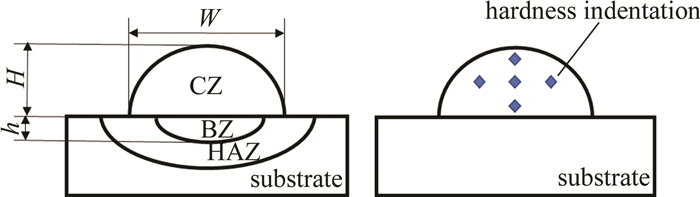
图 1是熔覆粉末的扫描电镜图。熔覆前,用金相砂纸打磨基体表面,并用无水乙醇清洗、烘干,去除表面的杂质。实验设备采用XL-800WF光纤传输YAG激光加工系统。粉末的铺粉方式为粉末预置法。除去需要优化的工艺参数以外,其它的参数设置为:脉冲频率25Hz, 离焦量+1mm,粉末铺设厚度(1.0±0.2)mm。激光熔覆完成后,将试样进行切割、制备、抛光、腐蚀。腐蚀溶液是质量分数为0.05的硝酸酒精,腐蚀时间30s。采用金相显微镜测量熔覆层的高度H、宽度W、熔池的深度h,如图 2所示,以及用数显显微硬度机(MHVD-1000AT)测量熔覆层的显微硬度, 取平均值。

Figure 1. Scanning electron microscope micrograph of the cladding powder

Figure 2. Diagram of section morphology and hardness indentation of the cladding layer
可以根据激光熔覆层的宏观形貌和稀释率来判断其质量[21-23]。宏观形貌由三部分组成:熔覆区(cladding zone, CZ)、结合区(bond zone, BZ)和热影响区(heat affected zone, HAZ)。其几何尺寸可以通过熔覆层宽度W、高度H和熔池深度h来描述,稀释率是指在激光熔覆工序中,熔融后的熔覆层材料与母材的混合引起的熔覆合金组成的变化程度,这是控制激光熔覆过程的重要因素之一[24-25],宽高比也是控制熔覆层质量的有效方法,较大的宽高比可以获得良好的熔覆层质量, 如下式所示:
式中,η为稀释率。
1.1. 影响因素与响应目标的设定
1.2. 实验材料与方法
-
为了保证构建数学模型的精确性,在函数拟合中需要去除不显著项,即模型系数p值大于0.05。然后对响应目标熔覆层宽度、高度、熔池深度、稀释率、宽高比和硬度建立多项式回归模型。
-
对熔覆层宽度、高度和熔池深度的模型系数、失拟项进行显著性分析,结果如表 4、表 5和表 6所示。从表中可以观察到,3种模型的模型系数p值分别为0.0001, 0.0008, 0.0228,均小于0.05,说明模型具有显著性;模型中的失拟项系数F值和p值都远大于0.05,说明所建立的模型拟合精度高,影响因素对响应目标具有显著的影响性;多元系数Rs(0≤Rs≤1)的值接近于1,说明3种模型的相关性越好;有效信号与噪声的比值Ap分别为28.175, 15.273, 9.284,均远大于4,说明3种模型可信度较高。
source sum of square model degree of freedom mean square F-value p-value model 1.15 9 0.13 61.63 0.0001 significant X1 0.48 1 0.48 229.80 < 0.0001 X2 0.29 1 0.29 139.63 < 0.0001 X3 0.29 1 0.29 137.80 < 0.0001 X12 0.039 1 0.039 19.06 0.0072 X22 0.036 1 0.036 17.56 0.0086 residual 0.010 5 2.068×10⁻³ lack of fit 5.475×10⁻³ 3 1.825×10⁻³ 0.75 0.6148 not significant pure error 4.867×10⁻³ 2 2.433×10⁻³ total 1.16 14 注:Rs=0.9911;Ap=28.175 Table 4. Analysis of variance of the cladding layer width
source sum of square model degree of freedom mean square F-value p-value model 0.19 9 0.021 30.01 0.0008 significant X1 0.060 1 0.060 85.63 0.0002 X2 0.033 1 0.033 46.78 0.0010 X3 8.000×10⁻⁴ 1 8.000×10⁻⁴ 1.15 0.3324 X1X2 1.000×10⁻² 1 1.000×10⁻² 14.39 0.0127 X12 0.072 1 0.072 104.13 0.0002 X22 9.231×10⁻³ 1 9.231×10⁻³ 13.28 0.0148 residual 3.475×10⁻³ 5 6.950×10⁻⁴ lack of fit 3.275×10⁻³ 3 1.092×10⁻³ 10.92 0.0851 not significant pure error 2.000×10⁻⁴ 2 1.000×10⁻⁴ total 0.19 14 注:Rs=0.9818;Ap=15.273 Table 5. Analysis of variance of cladding layer height
source sum of square model degree of freedom mean square F-value p-value model 0.034 9 3.824×10⁻³ 6.97 0.0228 significant X1 0.020 1 0.020 36.47 0.0018 X2 0.012 1 0.012 21.91 0.0054 X3 1.250×10⁻⁵ 1 1.250×10⁻⁵ 0.023 0.8859 residual 2.742×10⁻³ 5 5.483×10⁻⁴ lack of fit 8.750×10⁻⁴ 3 2.917×10⁻⁴ 0.031 0.8197 not significant pure error 1.867×10⁻³ 2 9.333×10⁻⁴ total 0.037 14 注:Rs=0.9262;Ap=9.284 Table 6. Analysis of variance of molten pool depth
由表 4可知,激光工艺参数中的输出电流X1、脉冲宽度X2、扫描速率X3对熔覆层的宽度影响最为重要,2阶输出电流X12和2阶脉冲宽度X22对熔覆层宽度的影响次之;由表 5可知,输出电流X1与2阶输出电流X12对熔覆层高度的影响最大,脉冲宽度影响次之,输出电流与脉冲宽度的交互项(X1X2)和2阶脉冲宽度X22对熔覆层高度的影响较为接近,扫描速率X3对熔覆层高度的影响不显著(p>0.1);由表 6可知,激光工艺参数对熔池深度的影响从低到高依次为:X3<X2<X1。
通过BBD方法可以得到每个模型的回归系数,熔覆层宽度、高度、熔池深度的拟合回归方程见下式:
-
由表 7可知,该模型的模型系数p值为0.0001,远小于0.05,且失拟项系数F值和p值均大于0.05,表明模型具有较高的显著性,拟合精度高,工艺参数对熔覆层宽高比具有显著影响;多元系数Rs=0.9910,趋近与1,说明模型具有相关性;有效信号与噪声的比值Ap=21.790,说明模型具有较高的辨识率。通过对比各项激光工艺参数,发现输出电流X1和2阶输出电流X12对宽高比的影响最为显著,扫描速率次之,虽然脉冲宽度X2对宽高比的影响不显著(p>0.1),但是输出电流与脉冲宽度的交互项具有显著的影响,输出电流与扫描速率的交互项也对宽高比有显著性影响。最终得到宽高比模型的拟合回归方程如下式所示:
source sum of square model degree of freedom mean square F-value p-value model 11.71 9 1.30 61.07 0.0001 significant X1 7.13 1 7.13 334.60 < 0.0001 X2 3.200×10⁻³ 1 3.200×10⁻³ 0.15 0.7142 X3 0.52 1 0.52 24.19 0.0044 X1X2 0.14 1 0.14 6.60 0.0500 X1X3 0.21 1 0.21 9.94 0.0253 X12 3.51 1 3.51 164.83 < 0.0001 residual 0.11 5 0.021 lack of fit 0.087 3 0.029 2.99 0.2604 not significant pure error 0.019 2 9.700×10⁻³ total 11.81 14 注: Rs=0.9910;Ap=21.790 Table 7. Analysis of variance of cladding layer width to height ratio
-
从表 8可知,稀释率的模型系数p=0.0029 < 0.05, 说明该模型具有显著性,回归方程拟合良好,失拟项的p=0.9219>0.05,F=0.15>0.05, 表明实验模型的误差较小,模型精度高,多元系数Rs=0.9689,说明实验值与预测值的一致性较高,有效信号与噪声的比值为14.252,远大于4,说明模型具有较高的可信度与准确度。通过比较各项激光工艺参数的均方差F值和p值的大小可以得出,输出电流X1对稀释率的影响最为显著,脉冲宽度X2对稀释率的影响较为显著,输出电流与脉冲宽度的交互项(X1X2)对稀释率的影响显著,结果表明, 工艺参数对铁基TiC复合涂层稀释率的影响从低到高依次为:X3 < X1X2 < X2 < X1。最终得到稀释率模型的拟合回归方程如下式所示:
source sum of square model degree of freedom mean square F-value p-value model 558.93 9 62.10 17.33 0.0029 significant X1 437.78 1 437.78 122.18 0.0001 X2 69.97 1 69.97 19.53 0.0069 X3 3.200×10⁻³ 1 3.200×10⁻³ 8.931×10⁻⁴ 0.9773 X1X2 29.11 1 29.11 8.12 0.0358 residual 17.92 5 3.58 lack of fit 3.27 3 1.09 0.15 0.9219 not significant pure error 14.64 2 7.32 total 576.84 14 注:Rs=0.9689;Ap=14.252 Table 8. Analysis of variance of cladding layer diluton rate
-
从表 9可知,模型系数p=0.0263,远远低于临界值0.05,且失拟项的p>0.05,证明模型的误差较小,显著性较高,多元系数的值充分接近于1,有效信号与噪声的比值远远大于4,表明模型的相关性好,可信度较高。输出电流对硬度的影响较为重要,脉冲宽度对硬度没有显著性影响,但是2阶脉冲宽度具有显著性影响,扫描速率也对硬度具有显著性影响。最终得到硬度模型的拟合回归方程如下式所示:
source sum of square model degree of freedom mean square F-value p-value model 17335.45 9 1926.16 6.53 0.0263 significant X1 11235.00 1 11235.00 38.07 0.0016 X2 657.03 1 657.03 2.23 0.1959 X3 1610.28 1 1610.28 5.46 0.0667 X22 2087.08 1 2087.08 7.07 0.0449 residual 1475.70 5 295.14 lack of fit 1311.64 3 437.21 5.33 0.1620 not significant pure error 164.06 2 82.03 total 18811.16 14 注: Rs=0.9216;Ap=8.754 Table 9. Analysis of variance of cladding layer hardness
-
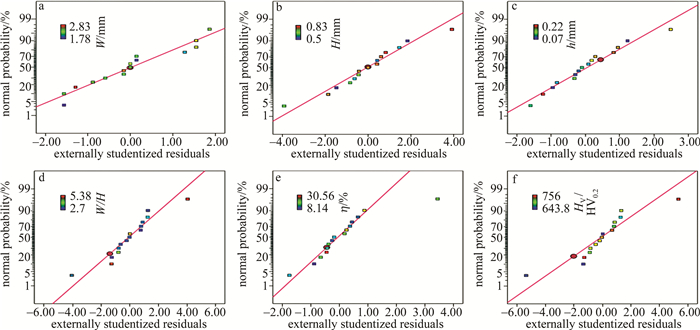
图 3为各个响应目标残差的正态分布图。从图 3可以看出,残差的正态概率分布十分近似于直线,表明模型的适应性较好。

Figure 3. Response target residual normal distribution diagram
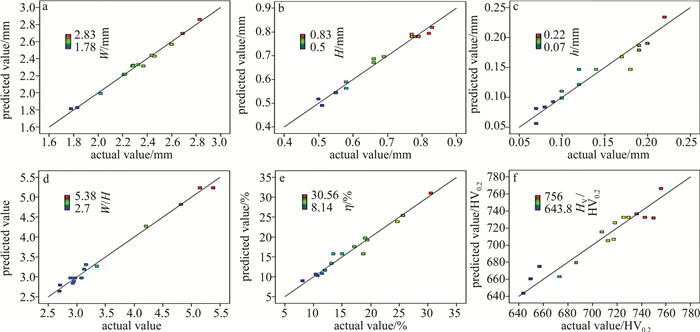
图 4是响应目标的预测值与实际值图,结果表明,数学模型的预测值与实验的实际值一致性较高,数据较为吻合,说明模型的精确程度较高。

Figure 4. The predicted and actual values of the response target
-
为了更好地说明工艺参数对熔覆层的宽度、高度、熔池深度、宽高比和稀释率以及硬度的影响,采用BBD设计方案中的摄动图、等高线图、3-D响应曲线图进行分析。
-
从图 5a可以看出,由于输出电流和脉冲宽度的增加,熔覆层宽度也随之增加,因为脉冲宽度越大,基材能够接收到宽度更宽的高能激光束;当输出电流增大时,激光能量密度的峰值增加,进入到熔覆层材料和基底的热量越多,致使熔池的尺寸增加,从而使得熔覆层的宽度变宽;但随着扫描速率的增加,熔覆层宽度反而变小,造成这种现象的原因是扫描速率越高,激光束停留在熔覆层和基体的单位时间降低,熔池尺寸减小,使得熔覆层宽度变窄。从图 5b和图 5c可以看出,当脉冲宽度为3ms时,较大的输出电流和较小的扫描速率可以得到大的熔覆层宽度。

Figure 5. Relationship between process parameters and cladding layer width
-
由图 6a可以观察出,在中心点处的前半段,随输出电流的增加,熔覆层的高度也逐渐增加,这是因为此时的输出电流能够完全把铺设在基体上的粉末融化,但是在中心点之后随着输出电流的继续增大,熔覆层高度反而降低,显然,这时的激光能量密度的峰值较大,造成熔覆层材料气化,形成较低的熔覆层高度;当脉冲宽度增加时,降低了激光束中心处的粉末向下滑落的趋势,所以熔覆层高度也增大;当扫描速率增加时,熔覆层高度降低,由于较大的扫描速率使得粉末材料接收到的激光束能量变少,粉末没有融化,使得高度降低。由图 6b、图 6c可知,当扫描速率为300mm/min时,较低的扫描速率和较大的脉冲宽度能够形成较高的熔覆层。

Figure 6. Relationship between process parameters and cladding layer height
-
由图 7a可知,熔池的深度随着输出电流和脉冲宽度的增加而增加,输出电流增大,激光功率也相应的增大,激光能量密度峰值提高,能量不均匀性降低,激光束进入到基材表面的能量越大,熔池的尺寸在一定程度上增加;脉冲宽度增大,光斑中心位置由于能量密度较大导致熔池较深;而扫描速率对熔池深度影响不显著;由图 7b、图 7c分析可知,当扫描速率为300mm/min时,较高的输出电流和较大的脉冲宽度能够形成较深的熔池深度。

Figure 7. Relationship between process parameters and molten pool depth
-
从图 8a可知,由于输出电流的增加,宽高比也迅速增加,较大的输出电流可以形成较宽的熔覆层宽度、较低的熔覆层高度,从而得到较大的宽高比;随着扫描速率的增加,宽高比逐渐变小,这是因为扫描速率越大,熔覆层的宽度急剧减小,从而导致较低的宽高比; 脉冲宽度对宽高比不显著。图 8b、图 8c表明,当扫描速率为300mm/min时,较大的输出电流和较高的脉冲宽度可以得到较大的宽高比。

Figure 8. Relationship between process parameters and aspect ratio
-
从图 9a可以观察出,稀释率随着输出电流与脉冲宽度的增大而增大,因为较大的输出电流和脉冲宽度,单位时间内使基体能够接收到更多的激光束能量,从而使熔池的尺寸增大;扫描速率对稀释率不显著。图 9b、图 9c表明,当扫描速率为300mm/min时,较高的输出电流与脉冲宽度能够形成较大的稀释率。

Figure 9. Relationship between process parameters and dilution rate
-
由图 10a可知,由于输出电流的增加,熔覆层硬度也逐渐增加,因为输出电流增加,激光功率变大,熔覆层中的TiC粉末与铁基粉末能够很好的融合,形成了硬度较高的熔覆层;在中心点以前随着脉冲宽度的增加,单位时间内高能激光束能够熔融更多的陶瓷粉末与铁基粉末,使得熔覆层硬度逐渐增加,到达中心点以后,随着脉冲宽度的持续增加,熔池的尺寸变大,熔覆层的高度也相应的增大,更多陶瓷TiC粉末进入熔池,致使熔覆层中TiC粉末的含量降低,从而导致硬度减少;而熔覆层的硬度则随着扫描速率的增大而增大,这是因为扫描速率增加,基体与熔覆层接收的激光束能量减少,涂层的几何尺寸减小,涂层单位面积内TiC的含量增加,从而使得硬度增加。图 10b、图 10c表明,当脉冲宽度为3ms时,较高的输出电流和较大的扫描速率可以得到高的熔覆层硬度。

Figure 10. Relationship between process parameters and hardness of cladding layer
-
为了获得质量较好且硬度高的熔覆层,通过选取稀释率、宽高比、硬度3个响应目标来进行工艺参数的优化,稀释率是评价熔覆层质量的重要指标,较大的宽高比与硬度可以获得质量较好且硬度较高的熔覆层。
-
从表 2可知,实验测得的响应目标稀释率的数值范围为8.14%~30.56%,所以采用以稀释率以5%为间隔,择取7#、14#、10#、8#、4#这5个具有代表性的试样进行分析,如图 11所示。每个试样对应的稀释率分别为10.39%, 15.05%, 19.42%, 24.68%, 30.56%,通过对比发现,当稀释率为10.39%和15.05%时,熔覆层与基体结合良好,但熔覆表面夹杂有未能充分与熔覆层融合的粉末颗粒;当稀释率为19.42%时,随着稀释率的增加,熔覆层中出现黑色气孔;当稀释率为24.68%时,可以发现,熔覆层不仅截面光滑平整,而且没有气孔,熔覆层与基体结合良好;当稀释率为30.56%时,随着稀释率的进一步的增大,更多的粉末进入了熔池,致使裂纹在熔覆层的上部出现了,同时熔覆表面夹杂有未与熔覆层充分融合的颗粒;因此在工艺参数的优化过程中,选择在稀释率为25%的目标下,尽可能地取宽高比、硬度为最大值,如表 10所示。
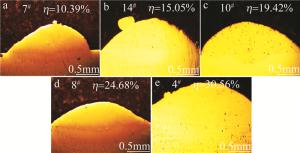
Figure 11. Macro morphology of the cladding bonding area of different samples(25×)
name goal lower limits upper limits X1/A in range 135 165 X2/ms in range 2.5 3.5 X3/(mm·min-1) in range 250 350 W/H maximize 2.7 5.38 η/% 25 8.14 30.56 HV/HV0.2 maximize 643.8 756 Table 10. Optimization conditions and goals
-
由表 11可以看出,最终工艺参数优化组合,输出电流为165A、脉冲宽度为3ms、扫描速率为296mm/min时,期望值(desirability)达到了0.939,表明期望值较大,优化工艺参数比较理想。根据获得的理想工艺参数,再做3组进行实验验证,对比数据结果可以发现, 3组优化目标宽高比、稀释率、硬度的平均误差分别为:1.5%, 4.8%, 4.1%,均在5%以内。因此,可以说明模型构建合理、准确精度高、可靠性好,满足优化工艺参数要求,对提升铁基TiC复合涂层的质量,硬度有着重要的意义。
number X1/A X2/ms X3/(mm·min-1) W/H η/% HV/HV0.2 desirability predict 165 3 296 4.922 25 756 0.939 selected 165 3 296 4.894 24.2 707.8 experimental 165 3 296 4.745 26.7 774.5 165 3 296 4.921 26.1 729.5 average error/% 1.5 4.8 4.1 Table 11. Optimization results and verification
2.1. 响应面数学模型的建立
2.1.1. 熔覆层几何参数的数学模型
2.1.2. 宽高比的数学模型
2.1.3. 稀释率的数学模型
2.1.4. 熔覆层硬度的数学模型
2.1.5. 模型验证
2.2. 各因素对响应目标的影响关系
2.2.1. 熔覆层宽度

2.2.2. 熔覆层高度

2.2.3. 熔池深度

2.2.4. 宽高比

2.2.5. 稀释率

2.2.6. 熔覆层硬度

2.3. 工艺参数优化及模型验证
2.3.1. 确定优化条件及目标

2.3.2. 工艺参数优化结果及验证
-
基于YAG激光加工系统,采用BBD设计实验,构建了影响因素与响应目标的数学模型,研究了输出电流、脉冲宽度、扫描速率对熔覆层的影响,并对工艺参数进行了优化。
(1) 输出电流、脉冲宽度、扫描速率三者对熔覆层宽度有主要的影响;而熔覆层高度和深度则主要受到输出电流的影响,脉冲宽度次之,扫描速率对其没有显著性影响。
(2) 工艺参数对宽高比的影响从低到高依次为脉冲宽度、扫描速率、输出电流;输出电流与脉冲宽度的交互项对稀释率有显著性, 高输出电流和较大的脉冲宽度可以得到较大的稀释率;对硬度的影响从低到高为脉冲宽度、扫描速率、输出电流,较高的输出电流和较大的扫描速率能够形成高硬度的熔覆层。
(3) 经优化后,获得最优工艺参数组合为:输出电流165A、扫描速率296mm/min、脉冲宽度3ms,响应目标宽高比、稀释率、硬度的误差均在5%以内,模型准确、精度高。
 DownLoad: