Advanced Search

ISSN1001-3806 CN51-1125/TN Map

Volume 46 Issue 3
May  2022
Article Contents
Turn off MathJax

Citation:

Research on intelligent assembly correction system based on multi-FBG network

  • Corresponding author: CHEN Hanmei, 18274030@qq.com
  • Received Date: 2021-04-09
    Accepted Date: 2021-05-06
  • In order to obtain the status information of the workpiece stably under the working environment, the method of multi-fiber Bragg grating (FBG) network monitoring was adopted, and the multi-fiber grating sensors were distributed on the tooling of the assembly structure. On the basis of obtaining the real-time strain field data of the sensitive positions, the difference was analyzed. The function relationship between the assembly error and the strain field distribution, and the appropriate correction parameters were given. The results show that when 100N stress is applied to the workpiece, the maximum deformation value in the x-axis direction is 0.86mm, and the maximum value in the y-axis direction is 0.69mm; compared with the standard measurement data obtained by laser scanning, it can be seen that the test on the x-axis. The average error of the deformation value of the sensitive position is better than 4.7%, and the average error of the deformation value of the sensitive position tested on the y-axis is better than 3.9%. It is feasible to use optical fiber sensing to realize intelligent correction of the assembly process, and it has good linearity and repeatability in the entire test range, which can improve the effect of intelligent assembly control.
  • 加载中
  • [1]

    XU O, LU S, FENG S, et al. Novel fiber-laser-based fiber Bragg grating strain sensor with high-birefringence Sagnac fiber loop mirror[J]. Chinese Optics Letters, 2008, 6(11): 818-820. doi: 10.3788/COL20080611.0818
    [2]

    JIANG Y, DUAN Zh, ZHANG X L, et al. Research on the on-line measurement of a birefringence fiber loop mirror strain sensor[J]. Laser Technology, 2020, 44(3): 315-320(in Chinese).
    [3]

    ALANANY Y M, TAIT M J. Fiber-reinforced elastomeric isolators for the seismic isolation of bridges[J]. Composite Structures, 2016, 160(7): 300-311. doi: 10.1016/j.compstruct.2016.10.008
    [4]

    KUANG Y, GUO Y, XIONG L, et al. Packaging and temperature compensation of fiber Bragg grating for strain sensing: A survey[J]. Photonic Sensors, 2018, 8(4): 320-331. doi: 10.1007/s13320-018-0504-y
    [5]

    SHI Q, REN L, YOU R Zh, et al. Development and application of smart bolt based on FBG sensors[J]. Instrument Technique and Sensor, 2020, (12): 10-15(in Chinese).
    [6]

    LI Ch L, TANG J G, CHENG Ch, et al. FBG arrays for quasi-distributed sensing: A review[J]. Photonic Sensors, 2021, 11(1): 91-108. doi: 10.1007/s13320-021-0615-8
    [7]

    WANG X Y, DENGY Q. Multi-reflection optimization of FBG array[J]. Journal of Yanbian University(Natural Science Edition), 2020, 46(2): 134-139(in Chinese).
    [8]

    MENG X Q, YU J Zh, WANG J. Optical fiber sensor adjustment system for automated assembly process[J]. Semiconductor Optoelectronics, 2020, 41(4): 578-581(in Chinese).
    [9]

    MULLE M, YUDHANTO A, LUBINEAU G, et al. Internal strain a-ssessment using FBGs in a thermoplastic composite subjected to quasi-static indentation and low-velocity impact[J]. Composite Structures, 2019, 215(32): 305-316. doi: 10.1016/j.compstruct.2019.02.085
    [10]

    ARNALDO G, LEAL J, CAMILO A R, et al. Simultaneous mea-surement of pressure and temperature with a single FBG embedded in a polymer diaphragm[J]. Optics & Laser Technology, 2019, 112(93): 77-84. doi: 10.1016/j.optlastec.2018.11.013
    [11]

    YU C W, LEI S C, CHEN W S, et al. Downhole fiber optic tempe-rature-pressure innovative measuring system used in Sanshing geothermal test site[J]. Geothermics, 2018, 74(31): 190-196.
    [12]

    GUO Y X, LI X, KONG J Y, et al. Sliding type fiber Bragg grating displacement sensor[J]. Optics & Precision Engineering, 2017, 25(1): 50-58. doi: 10.3788/OPE.20172501.0050
    [13]

    BOTSIS J, HUMBERT L, COLPO F, et al. Embedded fiber Bragg grating sensor for internal strain measurement sin polymeric materials[J]. Optics and Laser sin Engineering, 2005, 43(3): 491-510. doi: 10.1016/j.optlaseng.2004.04.009
    [14]

    SUN B Ch, LI J Zh, ZHANG W T. Fiber Bragg grating sensor[J]. Optical Fiber Sensing and Structural Health Monitoring Technology, 2019, 26(4): 77-148.
    [15]

    XIAO H Zh, ZHANG Y N, SHEN L Y, et al. Research on curvature serialization in the curve reconstruction algorithm based on fiber Bragg gratings[J]. Chinese Journal of Scientific Instrument, 2016, 37(5): 993-999(in Chinese).
    [16]

    WANG J Y, LIU Zh Ch, LIN X Zh, et al. Fiber Bragg grating strain detection system for digital calibration[J]. Laser Technology, 2020, 44(5): 570-574(in Chinese).
    [17]

    YUCEL M, TORUN M. Simplified fiber Bragg grating-based temperature measurement system design with enhanced high signal-to-noise ratio[J]. Microwave & Optical Technology Letters, 2018, 60(4): 965-969.
    [18]

    ESEQUIEL M, LUIS P, ANDREAS T, et al. Optical sensors for bond-slip characterization and monitoring of RC structures. Sensors and Actuators, 2018, A280(1): 332-339. doi: 10.1016/j.sna.2018.07.042
    [19]

    JONAS H O, CHESINI G, VALDIR A S, et al. Simplifying the design of microstructured optical fibre pressure sensors[J]. Scientific Reports, 2017, 7: 372-381. doi: 10.1038/s41598-017-00409-z
    [20]

    SUN L, HAO H, ZHANG B B, et al. Strain transfer analysis of embedded fiber Bragg grating strain sensor[J]. Journal of Testing and Evaluation, 2016, 44(6): 2312-2320.
  • 加载中
通讯作者: 陈斌, bchen63@163.com
  • 1. 

    沈阳化工大学材料科学与工程学院 沈阳 110142

  1. 本站搜索
  2. 百度学术搜索
  3. 万方数据库搜索
  4. CNKI搜索

Figures(4) / Tables(1)

Article views(2195) PDF downloads(14) Cited by()

Proportional views

Research on intelligent assembly correction system based on multi-FBG network

    Corresponding author: CHEN Hanmei, 18274030@qq.com
  • 1. School of Computer Science and Engineering, Cangzhou Normal University, Cangzhou 061001, China
  • 2. School of Opto-Electronic Engineering, Changchun University of Science and Technology, Changchun 130013, China

Abstract: In order to obtain the status information of the workpiece stably under the working environment, the method of multi-fiber Bragg grating (FBG) network monitoring was adopted, and the multi-fiber grating sensors were distributed on the tooling of the assembly structure. On the basis of obtaining the real-time strain field data of the sensitive positions, the difference was analyzed. The function relationship between the assembly error and the strain field distribution, and the appropriate correction parameters were given. The results show that when 100N stress is applied to the workpiece, the maximum deformation value in the x-axis direction is 0.86mm, and the maximum value in the y-axis direction is 0.69mm; compared with the standard measurement data obtained by laser scanning, it can be seen that the test on the x-axis. The average error of the deformation value of the sensitive position is better than 4.7%, and the average error of the deformation value of the sensitive position tested on the y-axis is better than 3.9%. It is feasible to use optical fiber sensing to realize intelligent correction of the assembly process, and it has good linearity and repeatability in the entire test range, which can improve the effect of intelligent assembly control.

引言
  • 制造业从自动化向智能化发展是未来工业制造的重要方向[1],装配技术智能化的关键是能够实时监测装配体位姿、应力场分布[2]等状态信息,这也是当前智能装配技术的研究热点[3]。为了解决装配流程中由于装配误差导致的欠装配与过盈装配等问题,首先需要能够有效地获取待装配工件的应力场分布数据,从而完成对装配过程的修正与调整[4-7]

    目前,传统生产线或装配线上的自动化系统绝大部分是以固定位置配合固定扫描路径实现的,这也就意味着其不具备自动校正能力,当存在工况环境等引入误差时,就会造成制造或装配缺陷[8]。为了解决该问题,辅助修正的装配校正系统也分为几类:3维重建方法[9]、立体视觉分析方法[10]以及基于感知网络[11]的数据反演方法。3维重建方法主要包括三坐标机、激光雷达、激光扫描仪,其核心原理是通过激光对工件上每个点进行逐个扫描,从而重建工件点云实现的,通过计算工件的坐标与位姿就能给出制造或装配路径的修正参数。该方法优点是精度高、数据全面,缺点是受工件工作环境的开敞性影响明显,其激光扫描系统对环境稳定性要求较高。立体视觉分析方法常采用图像分析的方法实现,通过标定体的位置距离关系,解算目标的坐标信息,优点是结构简单、抗干扰能力强,缺点是3维结构到2维图像的投影往往造成特征数据丢失,对站位选择要求较高。基于感知网络的数据反演方法有通用应变片阵列、光纤传感阵列[12-13]等实现,其中光纤传感由于其体积小、不受电磁干扰等优点非常适用于本课题研究内容。故本文中主要研究了一种基于多光纤布喇格光栅[14-17](fiber Bragg grating,FBG)组网的智能装配修正系统。

1.   系统设计
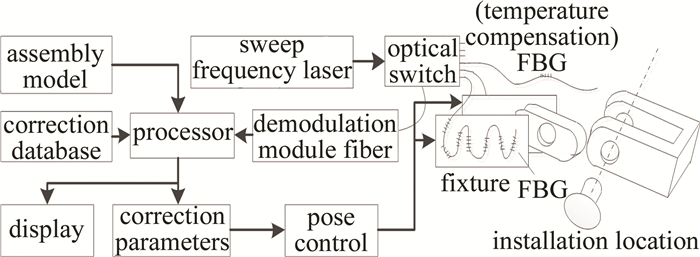
  • 为了完成自动装配过程的修正,需要通过计算夹具的受力分布完成位姿控制参数的修正,故本系统由扫频激光器、多路光开关、解调模块、FBG组、处理器及修正数据库等构成,如图 1所示。

    Figure 1.  Schematic diagram of fiber optic sensor adjustment system

    扫频激光器对覆盖FBG所有中心波长的范围进行扫描,从而使每一个FBG都会被扫描一次,获取每一个FBG的波长偏移量值,这个波长偏移量值由夹具相应位置上的应力变化所决定,故通过该值反演装配结构的装配状态。多路光开关用于切换扫描通道,因为FBG的波长响应需要一定的范围,故可以通过多路开关时分复用,实现大量FBG点位数据的获取。并且多路开关还采集相同装配位置处无应力作用的温度补偿FBG的波长偏移数据,用以对所有应力测试FBG进行温漂补偿。解调模块将回波的中心波长进行转换,从而实现数据分析。修正数据库按照预设应力状态完成对测试数据的修正。FBG组分布于夹具上,实现对夹具空间位置上应力值的实时获取,并将采集得到的数据与装配体数模进行对比,计算与理论位置的误差,并通过先验迭代出的修正数据库给出在该种情况下需要修正的位姿角度与距离补偿量。在装配过程中实时修正位置从而实现自动装配的目的。

  • 由于力是相互作用的,夹具与装配件之间力是大小相同、方向相反的[18], 故获取夹具上关键位置的应力分布就能够分析装配件的受力模式。对于FBG而言,设测试环境温度恒定,则解调可得第i个FBGi测试波长变量为:

    式中,λB, i表示第i个FBG的中心波长值,εi表示第i个FBG位置上的应变,Pε为弹光系数。根据胡克定律[19],应力与应变之间的函数可以表示为:

    式中,E表示弹性模量,I表示惯性矩,本系统针对钢材结构,故取E=210GPa,I=16.62×106mm4ε表示应变量;x表示测试位置,l表示施力点到微元的边界位置。由(1)式和(2)式联立可知,当已知FBG粘贴的位置时,即测试位置x为已知量,则可以通过测试FBGi的波长变量解算对应位置的受力值。在此基础上,构建位置修正参数矩阵与修正系数之间的关系有:

    式中,C1, C2, …, Cj表示修正系数;L1, L2, …, Lj则表示夹具控制单元对夹具位置的修正值。可见在3个轴向的修正值均可由修正系数与波长变量矩阵计算得到。由此,实现对装配过程的在线实时修正。

2.   仿真分析
  • 为了分析夹具不同位置受力后的应力场分布,采用ANSYS对铝合金材质的平面受力进行了仿真分析,得到了不同施力条件下结构的应力分布图。仿真平面的尺寸与装配结构一致,设长宽厚为150mm×100mm×10mm,各项同性材质铝合金密度为2.78g/m3,弹性模量为68.8GPa,泊松比为0.329。仿真不同位置分别为中间挤压与侧边挤压,与实际装配过程中插入不足和插入到位两种情况的受力状态相近,载荷沿z轴方向大小Fz=100N,仿真结果如图 2所示。

    Figure 2.  Force distribution on z-axis when inserted into different positions

    图 2是对两种装配过程中受力作用点不同时夹具形变量的仿真分析。图 2a是装配体插入不足时,装配体的顶端在夹持结构大约中间位置时造成的施力结果; 图 2b是装配体正常插入时顶部与夹持结构完全贴紧的施力结果。由仿真结果可知,由于插入的结构体前端为半圆形(如结构示意图 1所示),故其受力分布类似于由点施力造成的分布特征。由图 2a可见,从受力点向外变形量逐渐递减呈发散状;而图 2b中的应变场分布具有明显不同,在其受力位置上由于受到左右两侧的挤压,应变较为强烈的红色区域向两边延伸,而中间的应力增大,分析认为是由于装配结构中间位置开孔导致,使夹具改为应力不能直接与装配件接触释放应力,故导致对应通孔位置存在一定的应力集中。在相同的100N施力条件下,两种仿真结果中由于应力产生的形变最大值分别为10.9μm和14.1μm,并且由于位置的不同,响应的FBG也是不同的,故可以通过响应FBG的编号和波长偏移量值完成对应力强度的计算, 其计算关系中的比率kd/εd表示对应测试点位的位置偏移量,ε表示应变量,可采用Δλ和应变系数计算得到)。由此可见,不但可以实现定性分类,还能够完成定量分析,因此,采用应力测试数据分布解算修正系数是可行的。通过对夹具平面上分布的FBG应力测试值就可以计算得到当前装配结构的安装状态及受力程度,从而利用这些测试数据与修正数据库中对应的修正系数对装配位置进行补偿,达到在线修正装配轨迹与评估装配质量的目的。

3.   实验
  • 本测量系统中的应力传感器选用CASSTK公司的AAP-FBG,其铝合金封装与工件材质一致,从而保证弹性模量及张力系数相同,系统解调模块采用激光扫描匹配模式实现(设置一个可调频滤波器,对每一个FBG对应中心波长一定范围内进行扫描,当检测到最大峰值时记录其波长值,该波长值与FBG的原中心波长的差就是波长偏移量)。标定测试系统采用激光3维成像仪获取点云数据,然后通过POINTOOLS软件[20]完成目标曲面重建,从而分析本系统提供的面形形变偏移量的误差程度。测量过程中,夹具加紧带通孔的耳片进入安装位置,并外加一个力矩,通过本系统进行测量反演计算对安装件的面形偏移量。再通过光学扫描的结果分析本系统面形偏移量的测试结果误差大小。测试系统结构与耳片数模及FBG分布位置示意如图 3所示。

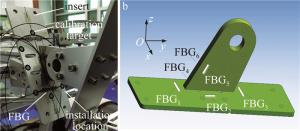
    Figure 3.  Schematic diagram of the physical and FBG distribution of test samples

    实验中工件上设置6个FBG,其数量选择原则是在能够表达装配件应力场状态信息的基础上尽量减少FBG的个数,目的是在实际应用时可在一个解调系统下完成更多装配位置的同时监测。测试中曾采用更多FBG,但边缘位置波长响应信噪比低,不利于状态解算,故最终选用了覆盖主要敏感位置的6个FBG完成数据获取。其位置确定原则是能够充分反映测试点位的应变值,由于实际装配中装配偏差产生的应力场都是沿其对应表面扩散的,使FBG轴向与其正交可获得更敏感的效果,故设置以上6个位置表征工件应力场状态最佳。

  • 为了与实际安装过程中的强迫装配应力对应,外加力矩采用两种形式: 一种是过插入状态,即沿y轴施力;另一种是装配位置不正,即沿x轴施力。由于z轴方向有安装孔限位,所以不需要专门进行分析,装配时以孔位的配合为准。测试过程中施力每次增大20N,持续15s等待结构受力稳定后计算位置偏移数据,共10次,当施力稳定为100N时测试数据如表 1所示。

    FBG No. y-axis direction FBG No. x-axis direction
    the system/mm optical system/mm error/% the system/mm optical system/mm error/%
    FBG1 0.19 0.021 9.5 FBG1 0.45 0.431 4.4
    FBG2 -0.46 -0.443 3.8 FBG2 0.12 0.108 9.5
    FBG3 -0.15 -0.017 10.0 FBG3 0.42 0.402 4.5
    FBG4 -0.48 -0.462 3.9 FBG4 -0.14 -0.129 8.5
    FBG5 0.66 0.639 3.2 FBG5 -0.86 -0.821 4.7
    FBG6 0.69 0.675 3.7 FBG6 0.85 0.813 4.6

    Table 1.  Comparison data table of position deviation

    由实验结果可知,本系统结果由FBG回波值计算得到,光学测量结果由激光扫描仪扫描靶标点得到。当外加应力施加在y轴方向时,FBG1与FBG3响应效果一正一负,FBG1是拉伸效果,FBG3是压缩效果,但由于FBG轴向与施力正交,故其响应较弱。相比FBG2和FBG4正作用于其应力方向,故其响应值较明显。而FBG5与FBG6由于在耳片突出的敏感部位,故其响应值最大,达0.69mm。与光学测量结果相比,除了不敏感的FBG1和FBG3位置误差较大外,其它位置的误差均在4.0%以内。当外加应力施加在x轴方向时,FBG2与FBG4响应效果一正一负,FBG2是拉伸效果,FBG4是压缩效果,其响应较弱。同时,FBG1和FBG3的响应比较强,而FBG5与FBG6由于在耳片突出的敏感部位,故其响应值最大,达0.86mm。与光学测量结果相比,除了不敏感的FBG2和FBG4位置误差较大外,其它位置的误差均在5.0%以内。x轴上测试的敏感位置形变值平均误差优于4.7%,y轴上测试的敏感位置形变值平均误差优于3.9%。对比发现,虽然施力大小一样,但是在x轴时造成的计算误差大于y轴,分析认为是耳片长边在y轴上,故相同施力时x轴方向造成的耳片形变更大,所以曲面形变引入的非线性误差增大导致。

  • 传感器测试曲线的线性度是反映传感性能的重要指标,同时其可重复性也是衡量系统是否能够稳定工作的重要标准。故针对两种不同应力施加情况,分别测试并绘制了其应力值-形变量响应曲线,结果如图 4所示。

    Figure 4.  Stress-deformation response curve

    测试过程中为了保证一定的信噪比,每次仅取敏感位置上FBG的测试数据,在y轴方向取FBG2, FBG4, FBG5, FBG6,在x轴方向取FBG1, FBG3, FBG5, FBG6。由应力值-形变量响应曲线可以看出,应力值与计算得到的形变量的线性度稳定。y轴方向时FBG2, FBG4, FBG5, FBG6的斜率分别为-0.0043, -0.0048, 0.0061, 0.0067,拟合后的R值分别是0.9914, 0.9929, 0.9945, 0.9953;x轴方向时FBG1, FBG3, FBG5, FBG6的斜率分别为0.0045, 0.0044, -0.0082, 0.0084,拟合后的R值分别是0.9891, 0.9891, 0.9948, 0.9813。可见,在整个测试范围内能够很好地反映施力与结构位置变形程度的关系。同时,根据其正负分布规律也能够看出其结构的拉伸与压缩状态,该结果验证了本系统的可行性。

4.   结论
  • 本文中针对装配过程中实时获取装配件状态信息从而完成修正参数设置的问题,提出了一种基于FBG组网的装配修正系统。系统通过在装配工装的合适位置上黏贴适量的FBG传感器,实现了对装配工装应力场的实时获取。利用FBG回波波长与应变之间的线性关系,完成了对装配件形变程度的准确描述。仿真分析了不同装配问题导致的应力场分布及FBG响应关系具有明显的标志性。实验通过与光学扫描方法进行对比,结果显示本系统在100N施力条件下,x轴和y轴对应的最大偏移量分别为0.86mm和0.69mm。在x轴和y轴上的形变量平均误差分别优于4.7%和3.9%,线性度平均值均优于0.98。验证了系统的可行性,体现了其在智能装配领域具有很好的应用前景。

Reference (20)

Catalog

    /

    DownLoad:  Full-Size Img  PowerPoint
    Return
    Return