Advanced Search

ISSN1001-3806 CN51-1125/TN Map

Volume 46 Issue 5
Sep.  2022
Article Contents
Turn off MathJax

Citation:

Two-component trace gas detection system based on combined laser light sources

  • Corresponding author: CHEN Ke, chenke@dlut.edu.cn
  • Received Date: 2021-08-30
    Accepted Date: 2021-11-04
  • Methane and acetylene are the most important characteristic gases when the transformer breaks down. In order to meet the demand for detecting the concentration of the trace CH4 and C2H2 dissolved in the transformer, the laser photoacoustic spectroscopy gas detection technology was adopted. By analyzing the near-infrared absorption spectrum of CH4 and C2H2 gas, the appropriate laser light source was selected and the laser modulation parameters were determined. A set of photoacoustic spectroscopy trace CH4 and C2H2 gas detection system with dual laser light source and a non-resonant photoacoustic cell were designed, and the detection sensitivity and low concentration detection error of the system for CH4 and C2H2 gas was obtained. The result shows that CH4 and C2H2 have good response linearity in the volume fraction range of 0~1000×10-6 and 0~500×10-6, respectively, and the responsivities are 5.8969μV and 16.1831μV per 10-6 volume fraction, respectively. The system is tested for repeatability and accuracy using low-content CH4/C2H2 mixed gas. The maximum absolute error of detection is 0.30×10⁻⁶ when the CH4 volume fraction is 3.00×10⁻⁶, and the maximum absolute error of detection is 0.20×10⁻⁶ when the C2H2 volume fraction of 0.50×10⁻⁶. The research results meet the technical index requirements of measurement error and achieve high-sensitivity detection of trace CH4 and C2H2.
  • 加载中
  • [1]

    BUSTAMANTE S, MANANA M, ARROYO A, et al. Dissolved gas analysis equipment for online monitoring of transformer oil: A review[J]. Sensors, 2019, 19(19): 4057-4070. doi: 10.3390/s19194057
    [2]

    AIZPURUA J I, CATTERSON V M, STEWART B G, et al. Power transformer dissolved gas analysis through Bayesian networks and hypothesis testing[J]. IEEE Transactions on Dielectrics and Electrical Insulation, 2018, 25(2): 494-506. doi: 10.1109/TDEI.2018.006766
    [3]

    AZMI A, JASNI J, AZIS N, et al. Evolution of transformer health index in the form of mathematical equation[J]. Renewable and Sustainable Energy Reviews, 2017, 76: 687-700. doi: 10.1016/j.rser.2017.03.094
    [4]

    GENERAL ADMINISTRATION OF QUALITY SUPERVISION, NSPECTION AND QUARANTINE OF THE PEOPLE'S REPUBLIC OF CHINA. GB/T 7252-2001 Guide to the analysis and the diagnosis of gases dissolved in transformer oil[S]. Beijing: China Standard Press, 2001(in Chinese).
    [5]

    MA G, WANG Y, QIN W, et al. Optical sensors for power transformer monitoring: A review[J]. High Voltage, 2021, 6(3): 367-386. doi: 10.1049/hve2.12021
    [6]

    GENERAL ADMINISTRATION OF QUALITY SUPERVISION, NSPECTION AND QUARANTINE OF THE PEOPLE'S REPUBLIC OF CHINA. GB/T 17623-2017 Determination of componential contents of gases dissolved in insulating oil by gas chromatography method[S]. Beijing: China Standard Press, 2017 (in Chinese).
    [7]

    JAMES A T, MARTIN A J P. Gas-liquid partition chromatography: The separation and micro-estimation of volatile fatty acids from formic acid to dodecanoic acid[J]. Biochemical Journal, 1952, 50(5): 679-690. doi: 10.1042/bj0500679
    [8]

    SUN C H, OHODNICKI P R, STEWART E M. Chemical sensing strategies for real-time monitoring of transformer oil: A review[J]. IEEE Sensors Journal, 2017, 17(18): 5786-5806. doi: 10.1109/JSEN.2017.2735193
    [9]

    ELEFANTE A, GIGLIO M, SAMPAOLO A, et al. Dual-gas quartz-enhanced photoacoustic sensor for simultaneous detection of methane/nitrous oxide and water vapor[J]. Analytical Chemistry, 2019, 91(20): 12866-12873. doi: 10.1021/acs.analchem.9b02709
    [10]

    MAO X F, ZHOU X L, ZHAI L, et al. Dissolved gas-in-oil analysis in transformers based on near-infrared photoacoustic spectroscopy[J]. International Journal of Thermophysics, 2015, 36(5): 940-946.
    [11]

    MAO Zh X, WEN J Y. Detection of dissolved gas in oil-insulated electrical apparatus by photoacoustic spectroscopy[J]. IEEE Electrical Insulation Magazine, 2015, 31(4): 7-14. doi: 10.1109/MEI.2015.7126069
    [12]

    CHEN K, ZHANG B, GUO M, et al. All-optical photoacoustic multigas analyzer using digital fiber-optic acoustic detector[J]. IEEE Transactions on Instrumentation and Measurement, 2020, 69(10): 8486-8493. doi: 10.1109/TIM.2020.2993333
    [13]

    CHEN K, LIU Sh, ZHANG B, et al. Highly sensitive photoacoustic multi-gas analyzer combined with mid-infrared broadband source and near-infrared laser[J]. Optics and Lasers in Engineering, 2020, 124: 105844-105851. doi: 10.1016/j.optlaseng.2019.105844
    [14]

    YUAN Sh, WANG G Zh, FU D H, et al. Cross interference characteristics of photoacoustic spectroscopy multi-gas analyzer[J]. Acta Photonica Sinica, 2021, 50(4): 0430002(in Chinese).
    [15]

    ZHAO Y, PAN Y, RUTHERFORD J, et al. Estimation of the interference in multi-gas measurements using infrared photoacoustic analyzers[J]. Atmosphere, 2012, 3(2): 246-265. doi: 10.3390/atmos3020246
    [16]

    DINH T V, CHOI I Y, SON Y S, et al. A review on non-dispersive infrared gas sensors: Improvement of sensor detection limit and interference correction[J]. Sensors and Actuators, 2016, B231: 529-538.
    [17]

    SHI M K, HU B, YING H Sh, et al. Research of photoacoustic spectroscopy effect of ethylene concentration detected by laser[J]. Laser Technology, 2016, 40(3): 426-431(in Chinese).
    [18]

    YANG Zh Y, LU R J, WANG Ch Sh. Measurement method of resonance frequency for longitudinal resonant photoacoustic cells[J]. Laser Technology, 2019, 43(3): 387-391(in Chinese).
    [19]

    CHEN K, GUO M, LIU S, et al. Fiber-optic photoacoustic sensor for remote monitoring of gas micro-leakage[J]. Optics Express, 2019, 27(4): 4648-4659. doi: 10.1364/OE.27.004648
    [20]

    CHEN K, YUAN Sh, GONG Zh F, et al. High sensitive detection for SF6 decomposition component of H2S based on laser photoacoustic spectroscopy[J]. Chinese Journal of Lasers, 2018, 45(9): 0911012(in Chinese). doi: 10.3788/CJL201845.0911012
    [21]

    YUN Y X, CHEN W G, SUN X C, et al. Photoacoustic detection of methane dissolved in transformer oil[J]. Proceedings of The Chinese Society for Electrical Engineering, 2008, 28(34): 40-46(in Chinese).
    [22]

    CHEN W, LIU B, ZHOU H, et al. Diode laser-based photoacoustic spectroscopy detection of acetylene gas and its quantitative analysis[J]. European Transactions on Electrical Power, 2012, 22(2): 226-234. doi: 10.1002/etep.588
    [23]

    MA Y F, HE Y, ZHANG L, et al. Ultra-high sensitive acetylene detection using quartz-enhanced photoacoustic spectroscopy with a fiber amplified diode laser and a 30.72kHz quartz tuning fork[J]. Applied Physics Letters, 2017, 110(3): 031107-031112. doi: 10.1063/1.4974483
    [24]

    CHEN K, GONG Zh F, YU Q X. Fiber-amplifier-enhanced resonant photoacoustic sensor for sub-ppb level acetylene detection[J]. Sensors and Actuators, 2018, A274: 184-188.
    [25]

    TOMBERG T, VAINIO M, HIETA T, et al. Sub-parts-per-trillion level sensitivity in trace gas detection by cantilever-enhanced photo-acoustic spectroscopy[J]. Scientific Reports, 2018, 8(1): 1848. doi: 10.1038/s41598-018-20087-9
    [26]

    NATIONAL ENERGY BOARD. DL/T1498.2-2016 Technical spe-cification for on-line monitoring device of transformation equipment-Part 2: On-line monitoring device of gases dissolved in transformer oil[S]. Beijing: China Electric Power Press, 2016(in Chinese).
  • 加载中
通讯作者: 陈斌, bchen63@163.com
  • 1. 

    沈阳化工大学材料科学与工程学院 沈阳 110142

  1. 本站搜索
  2. 百度学术搜索
  3. 万方数据库搜索
  4. CNKI搜索

Figures(8) / Tables(1)

Article views(2935) PDF downloads(19) Cited by()

Proportional views

Two-component trace gas detection system based on combined laser light sources

    Corresponding author: CHEN Ke, chenke@dlut.edu.cn
  • 1. China General Nuclear Power Group, Shenzhen 518100, China
  • 2. School of Optoelectronic Engineering and Instrumentation Science, Dalian University of Technology, Dalian 116024, China

Abstract: Methane and acetylene are the most important characteristic gases when the transformer breaks down. In order to meet the demand for detecting the concentration of the trace CH4 and C2H2 dissolved in the transformer, the laser photoacoustic spectroscopy gas detection technology was adopted. By analyzing the near-infrared absorption spectrum of CH4 and C2H2 gas, the appropriate laser light source was selected and the laser modulation parameters were determined. A set of photoacoustic spectroscopy trace CH4 and C2H2 gas detection system with dual laser light source and a non-resonant photoacoustic cell were designed, and the detection sensitivity and low concentration detection error of the system for CH4 and C2H2 gas was obtained. The result shows that CH4 and C2H2 have good response linearity in the volume fraction range of 0~1000×10-6 and 0~500×10-6, respectively, and the responsivities are 5.8969μV and 16.1831μV per 10-6 volume fraction, respectively. The system is tested for repeatability and accuracy using low-content CH4/C2H2 mixed gas. The maximum absolute error of detection is 0.30×10⁻⁶ when the CH4 volume fraction is 3.00×10⁻⁶, and the maximum absolute error of detection is 0.20×10⁻⁶ when the C2H2 volume fraction of 0.50×10⁻⁶. The research results meet the technical index requirements of measurement error and achieve high-sensitivity detection of trace CH4 and C2H2.

引言
  • 核电厂大型油浸式变压器是核电厂重要设备,变压器能否正常稳定运行,直接影响电网和核电厂的正常运行[1]。变压器在长期运行的过程中会出现老化过热、异常放电、接触不良等问题,如不能及时发现处理将会导致电网事故发生[2],因此对变压器运行状态的实时监测具有重要意义。目前核电厂及电网中常用的大型变压器属于油浸式变压器,其内部绝缘介质是液态的变压器油以及固体纤维素为主的绝缘物质[3]。当变压器内部出现故障时,会导致绝缘材料中的高碳有机分子裂解成小分子烃类气体[4]。不同的故障类型释放能量不同,产生的小分子烃类气体也不同,因此, 对变压器油中小分子烃类气体的含量检测已成为监测变压器运行状态和判断潜伏故障类型的最有效手段[5]。在众多变压器故障类型中,火花放电和电弧放电故障最为严重,产生的特征气体以C2H2气体为主[6]。同时,几乎所有故障类型的特征气体都包含CH4气体[2, 6]。因此,对变压器油中溶解的微量CH4和C2H2气体的含量检测至关重要。

    目前,对变压器油中溶解气体的微量组分检测方法有气相色谱法[7]; 气敏传感器法[8]和光声光谱法[9]。其中,气相色谱法虽然可以同时检测多组分气体,但是色谱柱的定期更换也大大增加了维护成本[7]; 气敏传感器法虽然检测过程简单,但在灵敏度、精度和重复性等指标上存在一定不足,难以满足现场对多组分微量气体检测的要求; 相比之下,光声光谱气体检测法凭借其灵敏度高、实时性好和无需载气等优势[10-11],正逐步成为大型变压器设备油中溶解气分析(dissolved gas analysis, DGA)的首选技术方案。光声光谱气体检测技术通常采用的红外光源主要有红外热辐射光源和激光器,近中红外光谱区是大多数气体分子的指纹吸收带,红外热辐射光源具有很宽的光谱发射范围,覆盖了大多数气体分子的吸收带,可以通过选择不同中心波长和带宽的滤光片检测多组分气体[12-13]。但是,由于滤光片的带宽一般在100nm量级,远远大于气体分子的吸收谱宽,不同分子的吸收谱线重叠在所难免,进而导致交叉干扰影响检测限度[14]。同时气体检测系统中的光学窗口和池壁吸收红外宽谱光[15-16],产生较强的同频背景信号,使得实际检测限度很难达到10-6量级。随着激光技术的快速发展,激光光源在光声光谱气体检测系统中得到了广泛应用[17-18]。由于激光具有窄线宽的优势,可以有效地减少气体分子吸收光谱重叠造成的交叉干扰[19-20]; 同时利用激光波长可调谐的特性,结合二次谐波-波长调制技术(2f-wavelength modulation spectroscopy, 2f-WMS)可以有效提升光声信号检测的信噪比,实现高灵敏度检测。2008年,YUN等人利用近红外分布反馈式(distributed feedback, DFB)激光器实现了对变压器油中的CH4气体检测,最低检测气体体积分数为50×10-6 [21]。2012年,实现了对微量C2H2气体的检测,获得1×10⁻⁶的检测灵敏度[22]。2017年,MA等人采用石英增强光声光谱技术(quartz-enhanced photoacoustic spectroscopy, QEPAS)结合掺铒光纤放大技术(erbium-doped fiber amplifier, EDFA), 实现了对C2H2气体体积分数为0.033×10⁻⁶的超高灵敏度探测[23]。虽然高Q值石英音叉提高了系统检测灵敏度,但该方法易受环境干扰导致共振频率漂移,使其现场应用的稳定性和精度难以保证。2018年,大连理工大学CHEN等人利用共振式光声池,结合EDFA技术和2f-WMS技术,实现对痕量C2H2气体的检测,检测极限达0.37×10⁻⁹ [24]。共振式光声池的高灵敏度是以较大采气量为代价实现的,针对变压器DGA在线分析现场气样量小的情况,2019年,该课题组利用小型非共振式光声池,采用DFB激光器与热红外光源配合滤光片的方法,实现对C2H2气体和CH4气体的同时检测,检测灵敏度分别为0.027×10⁻⁶和0.024×10⁻⁶ [13]

    本文中基于红外光声光谱气体检测技术,通过分析CH4和C2H2分子在近红外波段的吸收谱线,设计了一套双激光光源搭配非共振光声池的CH4和C2H2气体检测系统,结合2f-WMS技术,实现了对微量CH4和C2H2气体的高灵敏度检测。

1.   光声光谱气体检测技术原理
  • 光声光谱气体检测技术是通过探测气体吸收光能产生的声波大小进而获得待测气体体积分数的技术。在光声池中充满待测气体,处于基态的气体分子对特定波长的光能选择性吸收并跃迁到激发态,通过无辐射弛豫的方式释放热能,导致光声池中的气体膨胀,产生声波。当入射光被周期性信号调制时,光声池中将产生同频声波[25]。根据Lambert-Beer定律,声波的大小和光声池中待测气体的体积分数呈线性。通过微音器检测光声信号Y可以反解待测气体体积分数,检测到的光声信号可以表示为:

    式中,s为微音器的灵敏度; P为入射光功率; F为光声池池常数,和光声池的结构和材料有关; φ为待测气体的体积分数; α(ν)为该气体对波长为ν的光的吸收系数。

2.   光声系统的设计
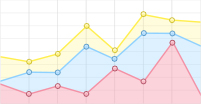
  • 变压器油中溶解气以小分子烃类为主,具有相同的官能团,导致吸收谱线重叠密集,检测过程中产生交叉干扰。利用激光光谱线宽窄的优势,使用目标气体的单一吸收谱线,可以大大减小检测过程中的吸收干扰。与其它变压器油中溶解气相比,CH4和C2H2两种气体在近红外波段存在较强的吸收峰,非常适合用近红外激光器作为激发光源。根据Hitran数据库,绘制出这两种气体体积分数为1×10⁻⁶下近红外波段的吸收系数,如图 1所示。考虑到空气中存在较高含量的水气和CO2,将这两种气体体积分数分别为5000×10-6和1000×10-6下的该波段的吸收系数也绘制在内。

    Figure 1.  CH4, C2H2 gases infrared absorption coefficient

    气体吸收谱线的选取原则应是优先选取吸收系数较高的吸收谱线,并且该波长处干扰气体的吸收系数尽可能小。由图 1可以看出,C2H2气体在波长1531.58nm处吸收最强,CH4气体在波长1650.96nm处吸收系数最强,同时,在这两处水气和CO2气体吸收干扰也较小。因此,将用于检测CH4和C2H2气体的两个DFB激光器的中心波长分别设置为1531.58nm和1650.96nm。

  • 基于组合激光光源的双组分微量气体检测系统的结构示意图如图 2所示。两个DFB激光器作为光声激发光源,DFB激光器被一个直流偏置信号和一个正弦波的组合信号调制,以产生二次谐波光声信号,其频率是激光器正弦调制信号的2倍。激光器驱动电路如图 3所示,主要由功率放大电路和恒温控制电路组成。功率放大电路用于驱动激光二极管发射激光;恒温控制电路对激光二极管的温度进行控制,用于对激光二极管进行散热并稳定激光波长。由于激光器的波长还可以通过电流进行调节,通过改变激光偏置电流的大小,使两个激光器的中心波长分别设置为1531.58nm和1650.96nm,输出光通过一个1×2光开关耦合进一根单模光纤,分时传输到准直器,经准直入射到光声池中。

    Figure 2.  Schematic diagram of the structure of a two-component trace gas detection system based on a combined laser light source

    Figure 3.  Physical picture of dual laser drive circuit

    光声池选用非共振式光声池,具有体积小和采气量小的优势,非常适合变压器油中溶解气分析中脱气量小的情况,光声池实物图如图 4所示。光声池材料为黄铜,内径为10mm,长度为30mm,气室总体积为2.4mL。非共振光声池内部声场分布均匀,利用高灵敏度电容式微音器提取激发的光声信号并转换成电信号。利用信号处理单元对信号进行弱信号放大、滤波等前置处理,信号处理单元由信号发生器(signal ge-nerator, SG)、数模转换器(digital to analog converter, DAC)、数字信号发生器(direct digital synthesis,DDS)、放大滤波器(amplifier & filter)和锁相放大器(lock-in amplifier)5个部分构成。再由现场可编程门阵列(field-programmable gate array, FPGA)数字锁相放大器提取与2f-WMS信号同频的信号,提高系统的信噪比,基于FPGA的信号处理单元如图 5所示。最后,将光声信号检测值发送给工控机,经LabVIEW软件对信号进行处理获取气体含量信息。

    Figure 4.  Physical image of non-resonant photoacoustic cell

    Figure 5.  Physical image of signal processing unit based on FPGA

3.   实验结果与分析
  • 为了验证组合激光光源的双组分微量气体检测系统的性能指标,搭建一套性能测试系统,系统结构示意图如图 6所示。利用两个质量流量控制器(七星华创,CS200)将气体体积分数为1000×10-6的CH4和500×10-6的C2H2混合气体和高纯氮气以特定比例混合。分别配置出CH4/C2H2体积分数为1000×10-6/500×10-6,500×10-6/200×10-6,250×10-6/100×10-6,100×10-6/50×10-6,50×10-6/10×10-6的混合气,将不同体积分数的混合气按照由小到大顺序依次通入光声池,通过DFB激光器的波长扫描对CH4和C2H2气体吸收线附近的2f-WMS信号进行探测。检测过程中通过控制关闭光声池以避免环境噪音和气体流动对检测过程造成的干扰。

    Figure 6.  Schematic diagram of the performance test system structure of the dual laser photoacoustic spectroscopy gas detection system

    通过设置两个激光器的偏置电流的扫描范围,使检测CH4气体的DFB激光器输出电流从102.0mA~109.0mA, 该电流范围覆盖CH4气体的吸收谱线1650.90nm,检测C2H2气体的DFB激光器输出电流从98.0mA~114.0mA,该电流范围覆盖C2H2气体的吸收谱线1531.58nm。两个激光器的工作温度稳定在25℃,锁相放大器的积分时间设置为1s。利用三级小波分解技术对光谱信号进行降噪处理[24],得到的不同体积分数的CH4和C2H2气体的光声2f-WMS信号分别如图 7a图 7b所示。其中2f-WMS信号峰值处对应的波长即为DFB激光器的中心波长,此时检测CH4气体的DFB激光器偏置电流为105.5mA,检测C2H2气体的激光器偏置电流为105.6mA。为了验证光声信号与气体体积分数的线性关系和系统检测范围,选取由低到高的5种不同体积分数CH4气体/C2H2气体进行检测,通过寻峰算法选取2f-WMS信号的峰值作为光声信号检测值进行线性拟合[20],结果如图 8a图 8b所示。由图 8可以看出,CH4和C2H2气体分别在体积分数为0~1000×10-6和0~500×10-6的范围内具有良好的线性响应,每10-6体积分数的检测响应度分别为16.1831μV和5.8969μV。该系统检测范围超过DL/T1498《变电设备在线监测装置技术规范》[26]中规定的变压器油中溶解CH4气体和C2H2气体的最高体积分数(分别为600×10-6和200×10-6),满足现场检测需求。

    Figure 7.  a—second harmonic signal of different volume fraction of CH4  b—second harmonic signal of different volume fraction of C2H2

    Figure 8.  Linearity fitting of measured values of photoacoustic signals at different volume fraction

    为了进一步测试系统的检测下限,根据DL/T 1498《变电设备在线监测装置技术规范》测量误差技术指标,选取体积分数为3.00×10⁻⁶/0.50×10-6的CH4/C2H2混合气体进行精度和重复性检测,重复测试5次,测试结果如表 1所示。对体积分数为3.00×10⁻⁶的CH4气体进行5次检测的平均值为3.00×10⁻⁶,显示的最高值为3.30×10⁻⁶,最低值为2.70×10⁻⁶,最大绝对误差为0.30×10⁻⁶。对体积分数为0.50×10⁻⁶的C2H2气体进行5次检测的平均值为0.64×10⁻⁶,显示的最高值为0.70×10⁻⁶,最低值为0.60×10⁻⁶,最大绝对误差为0.20×10⁻⁶。因此,该实验结果确定了系统对CH4和C2H2的检测下限分别达到3.00×10⁻⁶和0.50×10⁻⁶

    φ(CH4) φ(C2H2)
    volume fraction of standard gas 3.00×10⁻⁶ 0.50×10⁻⁶
    test volume fraction 1 3.10×10⁻⁶ 0.60×10⁻⁶
    test volume fraction 2 2.70×10⁻⁶ 0.60×10⁻⁶
    test volume fraction 3 2.70×10⁻⁶ 0.70×10⁻⁶
    test volume fraction 4 3.20×10⁻⁶ 0.70×10⁻⁶
    test volume fraction 5 3.30×10⁻⁶ 0.60×10⁻⁶
    average concentration 3.00×10⁻⁶ 0.64×10⁻⁶
    maximum absolute error 0.30×10⁻⁶ 0.20×10⁻⁶

    Table 1.  Low concentration repeatability and error test

4.   结论
  • 针对于变压器故障特征气体中微量CH4和C2H2气体含量检测的需求,本文中分析了CH4和C2H2气体在近红外波段的吸收谱线,确定了CH4和C2H2气体吸收谱线的中心波长分别为1650.90nm和1531.58nm。设计了基于组合激光光源的双组分微量气体检测系统,利用时分复用技术将两个激光器输出的不同波段的激光耦合进入非共振光声池来激发光声信号。光声信号的探测采用2f-WMS技术进行探测,结合三级小波分解去噪技术实现了对CH4和C2H2气体的高灵敏度检测。通过搭建测试系统,对CH4和C2H2的混合气体进行了测试。实验结果表明,CH4和C2H2气体分别在0~1000×10-6和0~500×10-6的体积分数范围内具有良好的线性响应。用低含量CH4/C2H2混合气体对系统进行重复性和精度检测,体积分数为3.00×10-6的CH4气体检测最大绝对误差为0.30×10-6,体积分数为0.50×10-6的C2H2气体检测最大绝对误差为0.20×10-6

    本系统相比于色谱法等传统油中溶解气检测法具有灵敏度高、结构简单和无需载气等优势,为变压器油中溶解气体中的微量CH4和C2H2气体的检测提供了一种较好的技术方案。

Reference (26)

Catalog

    /

    DownLoad:  Full-Size Img  PowerPoint
    Return
    Return