Advanced Search

ISSN1001-3806 CN51-1125/TN Map

Volume 47 Issue 2
Mar.  2023
Article Contents
Turn off MathJax

Citation:

Thermal strain measurement based on laser speckle digital image correlation method

  • Corresponding author: HE Shengnan, heshengnan@ahu.edu.cn
  • Received Date: 2022-02-28
    Accepted Date: 2022-03-22
  • In order to solve the problem of discoloration, melting and falling off of artificial speckles when the conventional digital image correlation method is applied to thermal strain measurement under high temperature conditions, the laser speckle was used as the characteristic texture method of the digital image correlation method. The correlation of speckle images before and after temperature change to measure metal thermal strain was calculated, experiments of heating specimens in a non-vacuum environment were carried out, the artificial speckle and laser tests on aluminum and tungsten specimens in a tubular heating furnace respectively vacuum heating experimental comparison of speckle were conducted.The corresponding speckle images were obtained and the mean strain curve data were calculated. The results show that in the non-vacuum environment, the laser speckle image jitters greatly due to the disturbance of heat flow, and the measured thermal strain curve has large interference noise. The thermal strain of aluminum with the temperature increases from room temperature to 450 ℃ and the thermal strain of tungsten with the temperature increases from room temperature to 800 ℃ is respectively consistent with the artificial speckle results. This study shows that the laser speckle digital image correlation method can effectively measure the dynamic thermal strain of the metal wall under the conditions of high vacuum and high heat flow similar to the fusion reactor divertor, which provides a new idea for the damage diagnosis of the first wall material of the fusion reactor divertor.
  • 加载中
  • [1]

    PAN B, LI K, TONG W. Fast, robust and accurate digital image co-rrelation calculation without redundant computations[J]. Experimental Mechanics, 2013, 53(7): 1277-1289. doi: 10.1007/s11340-013-9717-6
    [2]

    GAO Y, CHENG T, SU Y, et al. High-efficiency and high-accuracy digital image correlation for three-dimensional measurement[J]. Optics and Lasers in Engineering, 2015, 65: 73-80. doi: 10.1016/j.optlaseng.2014.05.013
    [3] 刘禹, 肖世德, 张睿, 等. 基于遗传算法的数字图像相关变形初值估计[J]. 激光技术, 2020, 44(1): 130-135.

    LIU Y, XIAO Sh D, ZHANG R, et al. Initial estimation of digital i-mage correlated deformation based on genetic algorithms[J]. Laser Technology, 2020, 44(1): 130-135(in Chinese).
    [4] 刘艳, 赵威, 李秋彤, 等. 基于数字图像相关法的扣件弹条模态特征识别试验研究[J]. 实验力学, 2021, 36(6): 804-816.

    LIU Y, ZHAO W, LI Q T, et al. Experimental study on the modal characteristics identification for the clip based on the digital image co-rrelation [J]. Journal of Experimental Mechanics, 2021, 36(6): 804-816(in Chinese).
    [5]

    PAN Zh W, HUANG S H, JIANG M L. In-situ measurements of deformation to fatigue failure on a flat-type divertor mockup under high heat flux loads by 3D digital image correlation[J]. Nuclear Fusion, 2020, 61(2): 026012.
    [6] 田文煜, 杜伟, 左宏, 等. 基于数字图像相关的金属材料低温裂尖张开位移试验测量方法[J]. 实验力学, 2020, 35(6): 1014-1022.

    TIAN W Y, DU W, ZUO H, et al. Experimental measurement method of low temperature crack tip opening displacement of metallic materials based on digital image correlation [J]. Journal of Experimental Mechanics, 2020, 35(6): 1014-1022(in Chinese).
    [7]

    PAN Zh W, HUANG S H, SU Y, et al. Strain field measurements over 3000℃ using 3D-digital image correlation[J]. Optics and Lasers in Engineering, 2020, 127: 105942. doi: 10.1016/j.optlaseng.2019.105942
    [8] 陈晨, 郭晓明, 马军, 等. 基于激光散斑角度相关法表面粗糙度测量[J]. 激光技术, 2015, 39(4): 497-500.

    CHEN Ch, GUO X M, MA J, et al. Measurement of surface roughness based on laser angular-speckle correlation method[J]. Laser Technology, 2015, 39(4): 497-500(in Chinese).
    [9]

    WU N, HARUYAMA S. Real-timeaudio detection and regeneration of moving sound source based on optical flow algorithm of laser speckle images[J]. Optics Express, 2020, 28(4): 4475-4488. doi: 10.1364/OE.383442
    [10]

    PANG Y, LINGAMANAIK S N, CHEN B K, et al. Measurement of deformation of the concrete sleepers under different support conditions using non-contact laser speckle imagingsensor[J]. Engineering Structures, 2020, 205(12): 110054.
    [11] 梁美玲. 激光散斑图像分析测量纳米流体平均速度的研究[D]. 昆明: 昆明理工大学, 2019: 43-79.

    LIANG M L. Study on themeasurement of average velocity of nanofluids by laser speckle image analysis[D]. Kunming: Kunming University of Science and Technology, 2019: 43-79(in Chinese).
    [12]

    MEYER P, WAAS A M. Measurement ofin situ-full-field strain maps on ceramic matrix composites at elevated temperature using di-gital image correlation[J]. Experimental Mechanics, 2015, 55(5): 795-802.
    [13]

    SONG J L, YANG J H, LIU F J, et al. High temperature strain measurement method by combining digital image correlation of laser speckle and improved RANSAC smoothing algorithm[J]. Optics and Lasers in Engineering, 2018, 111: 8-18.
    [14]

    SONG J L, YANG J H, LIU F J, et al. Ultra-high temperature mechanical property test of C/C composites by a digital image correlation method based on an active laser illumination and background radiation suppressing method with multi-step filtering[J]. Applied Optics, 2019, 58(24): 6569-6580.
    [15]

    ZHENG Q, MASHIWA N, FURUSHIMAT. Evaluation of large plastic deformation for metals by a non-contacting technique using digital image correlation with laser speckles[J]. Materials & Design, 2020, 191: 108626.
    [16]

    SONG J L, YANG J H, LIU F J, et al. Quality assessment of laser speckle patterns for digital image correlation by a multi-factor fusionIndex[J]. Optics and Lasers in Engineering, 2020, 124: 105822.
    [17] 曾毅. 激光散斑测量应用研究[D]. 重庆: 重庆大学, 2005: 5-6.

    ZENG Y. Study onapplication of laser speckle measurement[D]. Chongqing: Chongqing University, 2005: 5-6(in Chinese).
    [18] 胡海锋. 基于激光散斑图像的零件表面粗糙度测量[D]. 南京: 南京信息工程大学, 2015: 12-13.

    HU H F. Surfaceroughness measurement based on laser spackle i-mage [D]. Nanjing: Nanjing University of Information Science and Technology, 2015: 12-13(in Chinese).
    [19]

    YAMAGUCHI I. Alaser-speckle strain gauge[J]. Journal of Phy-sics, 2000, E14(11): 1270-1273.
    [20]

    PETERS W H. Digital image techniques in experimental stressanalysis[J]. Optical Engineering, 1982, 21(3): 427-431.
    [21] 宋金连. 基于激光散斑数字图像相关的超高温变形测量方法研究[D]. 北京: 北京科技大学, 2020: 10-12.

    SONG J L. Research on ultra-high temperature deformation measurement method based on digital image correlation with laser speckle[D]. Beijing: University of Science and Technology Beijing, 2020: 10-12(in Chinese).
  • 加载中
通讯作者: 陈斌, bchen63@163.com
  • 1. 

    沈阳化工大学材料科学与工程学院 沈阳 110142

  1. 本站搜索
  2. 百度学术搜索
  3. 万方数据库搜索
  4. CNKI搜索

Figures(7) / Tables(4)

Article views(2894) PDF downloads(35) Cited by()

Proportional views

Thermal strain measurement based on laser speckle digital image correlation method

    Corresponding author: HE Shengnan, heshengnan@ahu.edu.cn
  • 1. Institutes of Physical Science and Information Technology, Anhui University, Hefei 230601, China
  • 2. Department of Modern Mechanics, University of Science and Technology of China, Hefei 230027, China

Abstract: In order to solve the problem of discoloration, melting and falling off of artificial speckles when the conventional digital image correlation method is applied to thermal strain measurement under high temperature conditions, the laser speckle was used as the characteristic texture method of the digital image correlation method. The correlation of speckle images before and after temperature change to measure metal thermal strain was calculated, experiments of heating specimens in a non-vacuum environment were carried out, the artificial speckle and laser tests on aluminum and tungsten specimens in a tubular heating furnace respectively vacuum heating experimental comparison of speckle were conducted.The corresponding speckle images were obtained and the mean strain curve data were calculated. The results show that in the non-vacuum environment, the laser speckle image jitters greatly due to the disturbance of heat flow, and the measured thermal strain curve has large interference noise. The thermal strain of aluminum with the temperature increases from room temperature to 450 ℃ and the thermal strain of tungsten with the temperature increases from room temperature to 800 ℃ is respectively consistent with the artificial speckle results. This study shows that the laser speckle digital image correlation method can effectively measure the dynamic thermal strain of the metal wall under the conditions of high vacuum and high heat flow similar to the fusion reactor divertor, which provides a new idea for the damage diagnosis of the first wall material of the fusion reactor divertor.

引言
  • 数字图像相关法(digital image correlation,DIC)基本思想是通过采集散斑纹理图像,再匹配参考图和变形图中的对应点,求解出全场的位移与变形。目前国内外对数字图像相关法的研究主要在算法与应用方面。算法上常用的是反向高斯-牛顿算法,能较大程度地提高相关计算效率[1-2]。国内,LIU等人提出了一种基于遗传算法的相关算法,在搜索性能、图像匹配等方面更加可靠[3]。在应用方面,常用的图像表面特征纹理为人工散斑。LIU等人基于高速DIC准确获得了高铁上扣件弹条模态特征参数[4]。PAN等人利用3维DIC对钨铜材料进行疲劳变形和损伤应变的测量[5]。TIAN等人基于DIC在低温环境下对天然气管线钢材裂尖张开位移进行测量[6]。在高温环境下,由于热流冲击会导致人工散斑容易变色、熔化、脱落等,使特征点识别度降低甚至消失。虽然发展了一些耐高温材料作为人工散斑来应对上述问题[7],然而在类似聚变堆偏滤器等特定环境下,仍然不允许使用人工散斑,主要原因是人工散斑有可能带入杂质,对等离子体运行造成影响,严重地限制了传统DIC法的应用。激光散斑是高度相干性的激光照射在粗糙金属壁表面形成的干涉图样,因此,采用激光散斑作为DIC法的特征纹理,其散斑特征不会随温度变化而脱落,且散斑无需特殊复杂的制备工艺,故该方法有良好的应用前景。

    激光散斑由于其光路简单、操作方便等优点被广泛应用于工业生产、力学测量等方面。CHEN等人利用激光散斑方法对粗糙度标准模块的表面粗糙度完成实际测量[8]。WU等人通过激光散斑检测和再生音频信号[9]。PANG等人将激光散斑运用于混凝土枕木的变形测量[10]。LIANG将激光散斑运用于纳米流体速度的测量[11]

    基于激光散斑的数字图像相关方法,目前也有较多研究。MEYER等人使用激光散斑DIC在不同温度下,对有单切口的陶瓷基复合材料试样进行单向拉伸,监测每个裂纹的演化至断裂[12]。SONG等人基于激光散斑数字图像相关技术提出了一种采用改进的随机抽样一致性算法的位移场平滑算法,并在2000 ℃下对碳复合材料进行拉伸试验,验证了该方法的可行性[13-14]。ZHENG等人采用激光散斑结合DIC方法对不同材料进行单轴拉伸实验,验证了该方法的可行性,并在高温下实现了金属薄膜的拉伸应变测量[15]。SONG等人结合散斑灰度、对比度以及散斑颗粒大小提出了多因素融合指标对激光散斑质量进行评估,为散斑图像采集中参数的选择提供了理论依据[16]。上述工作基本上都应用于机械拉伸应变的测量,还未见有在聚变堆偏滤器高真空、高温和高热流冲击条件下,由于温度变化使试件发生形变,对热应变进行测量的应用报道。本文中的工作重点是将激光散斑与DIC技术相结合,用于测试聚变堆偏滤器金属壁面受到热流冲击后,由于热膨胀引起的热应变。

1.   基本原理
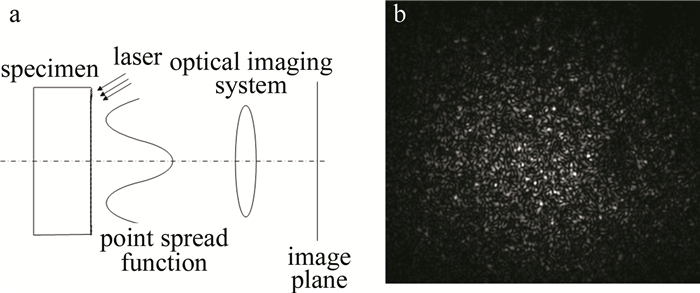
  • 粗糙表面是由大量无规则的面元组成的,当用长相干的激光照射物体表面时,不同的面元对相干光反射或者散射形成不同的光程差,这些反射或者散射光的子波在空间中相互干渉,在物体表面形成随机分布的亮点与暗点,这些亮暗相间的点就是激光散斑。让光经过光学系统,在物体表面形成的散斑称为主观散斑。主观散斑原理如图 1a所示,激光散斑如图 1b所示[17-18]

    Figure 1.  a—principle of subjective speckle  b—laser speckle

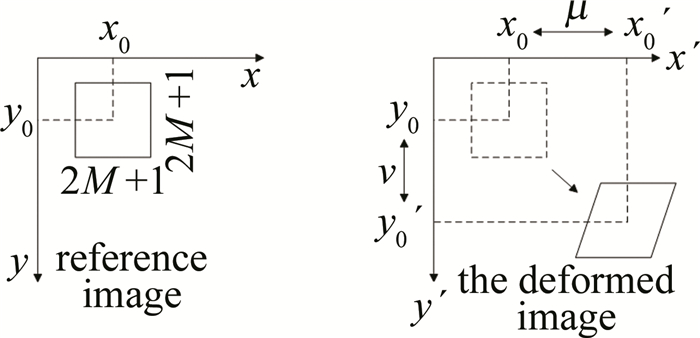
  • 数字图像相关法最开始由美国的PETERS和日本的YAMAGUCH在20世纪80年代初分别提出[19-20],该方法处理的是变形前后试件表面的散斑图像,图 2所示为其基本原图。在参考图像f(xy)中取以某点(x0y0)为中心(2M+1)×(2M+1)像素大小的正方形参考图像子区,在变形后图像g(x′y′)中通过亚像素搜索的方法按定义的相关函数来进行相关计算,在变形后图像中寻找与参考图像子区的相关系数最大值的以(x′0y′0)为中心的区域,即目标子区。根据目标子区分别确定参考图像子区中心点(x0y0)的x方向和y方向的位移分量uv。对全部子区进行相关计算,就可以获得全场变形信息。

    Figure 2.  Principle of DIC method

    将变形前后图像子区间的相似度量函数定义为相关函数,目前主要应用的是零均值归一化互相关函数(zero mean normalized cross correlation function,ZNCC)[21]

    式中,f(xy)为参考图像点(x0y0)的灰度值,g(x′y′)为变形后图像点(x′0y′0)处的灰度值;f=(2M+1)-2$\sum\limits_{x=-M}^M \sum\limits_{y=-M}^M f(x, y)$和g=(2M+1)-2$\sum\limits_{x=-M}^M \sum\limits_{y=-M}^M g(x', y')$分别为参考图像和变形后图像,大小为(2M+1)×(2M+1)的子区的平均灰度值。

2.   实验
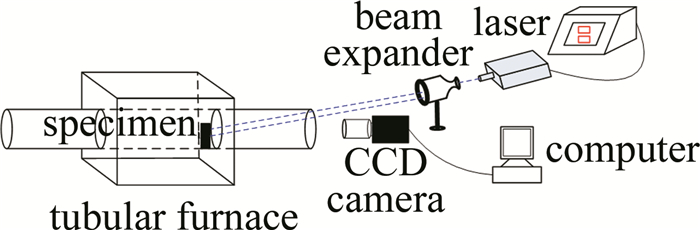
  • 搭建了基于激光散斑数字图像相关法的测量实验装置,装置光路如图 3所示。激光通过扩束镜照射在金属试件表面,并在试件表面形成亮暗相间的激光散斑,试件放在管式加热炉中进行加热,主要模拟聚变堆偏滤器真空和高热流实验环境。采用电荷耦合器件(charge-coupled device,CCD)相机采集温度变化过程中试件变形的激光散斑图像,并用数字图像相关软件PMLAB DIC进行计算,得到由于热膨胀产生的热应变。装置实物图如图 4所示。

    Figure 3.  Schematic diagram of the experimental setup

    Figure 4.  Experimental setup

    图 4中,管式炉前面加了一个窗口,用于激光的入射以及相机采集图片,后方连接真空泵。激光器采用532 nm的Nd∶YAG固态激光器,最大功率为3.71 W,并在激光出射口配有手动偏振衰减系统控制激光强度。CCD是Flir公司的GS3-PGE-60S6M相机,相机分辨率像素为2736×2192。相机前配有尼康AF-S80-400 mm长焦镜头,镜头上装有直径为77 mm、厚度为0.75 mm的532 nm窄带滤光片用以过滤杂散光。

  • (1) 为了了解热流扰动对激光散斑测量结果的影响,作者将试件放置在管式炉中并打开管式炉两端的窗口增加空气对流,然后对铝块的人工散斑试件和激光散斑试件分别进行加热,温度从室温升至450 ℃左右。用CCD相机进行图像采集,采集速度为每5 s获取1张散斑图,共采集550幅散斑图,并对结果进行计算。

    (2) 试件放置于管式加热炉内进行加热并通过真空泵抽真空,加热铝块的人工散斑试件使温度从室温升至450 ℃左右。用CCD相机进行图像采集,用相同的频率采集550幅散斑图,并对结果计算取平均值获取相应的热应变曲线。将同样大小的铝块放置于加热炉中,并将激光照射至试件表面形成激光散斑,调节激光强度以及曝光率获取合适的激光散斑,以相同时间将试件加热至相同温度,用CCD以相同频率采集散斑图像,并对图像进行计算获得应变平均值。

    (3) 为了考察激光散斑DIC法在托卡马克装置诊断中应用的可行性,接下来对钨材料进行了人工散斑和激光散斑对比试验,由于钨的热胀系数较低,为了获得较大的热应变量,采用真空管式加热炉将钨试件加热至800 ℃左右。使用CCD相机每10 s采集1幅图,共采集450幅散斑图,分别获得人工散斑和激光散斑应变曲线结果,并对结果同样取平均值。

3.   结果与分析
  • 图 5a图 5b分别是在非真空条件下人工散斑与激光散斑DIC法测得的铝试件应变结果。图中exxeyy分别代表x方向与y方向的热应变随升温时间的变化曲线。对比人工散斑与激光散斑的结果,两者热应变的变化趋势基本一致,其中激光散斑计算得到的应变结果绝对值略小于人工散斑。分析误差来源,可能是由于管式炉的非真空加热过程是开放式的,两次加热实验的试件温升曲线受环境温度影响较大,导致试件实际的温度变化曲线有差别。此外,相比于人工散斑,激光散斑的应变曲线出现了明显的抖动,这是由于在高温非真空环境下,空气温度分布不均匀造成热流扰动,使得试件表面附近的空气折射率发生变化,从而导致激光散斑图像出现抖动,降低了DIC计算时的图像相关性。因此,在使用激光散斑作为特征、用数字图像相关法计算热应变时,应尽量采用真空环境,避免空气热流扰动带来的计算误差。实验工况无法实现真空环境时,需要采用平滑算法修正,减小应变曲线的波动[13]

    Figure 5.  Speckle average strain curves of non-vacuum

  • 为了去除热流扰动影响,分别在管式加热炉中对人工散斑与激光散斑的铝(Al)块试件进行真空加热。在加热过程中以1张/5 s的帧率采集550张散斑图,并对散斑图用PMLAB DIC软件进行计算,对获取的x方向和y方向应变曲线取平均值。人工散斑结果如图 6a中所示,激光散斑如图 6b所示。根据管式炉设备显示,温度随时间变化如图 6c所示。将获取的人工散斑和激光散斑平均应变曲线进行比较,如图 6d所示。

    Figure 6.  Strain change and heating process of Al specimen

    根据图 6所示,铝试件真空加热实验的人工散斑与激光散斑热应变曲线都比较光滑,并且都呈现较好的金属各向同性,特别是激光散斑热应变曲线相比于非真空加热工况下的实验结果,曲线波动的噪声大大降低,计算精度也大大提高。表 1表 2中分别是xy方向上激光散斑热应变相比于人工散斑的绝对值差值百分比。

    time/s artificial speckle
    exxε
    laser speckle
    exxε
    error/%
    500 724.29 602.75 16.78
    750 1159.44 1056.07 8.92
    1000 1778.27 1658.66 6.72
    1500 3918.26 3818.12 2.56
    2000 6458.03 6785.45 5.07
    2500 9136.75 9571.47 4.76
    2750 10177.89 10885.16 6.95

    Table 1.  Aluminum test piece under vacuum error of thermal strain exx

    time/s artificial speckle
    eyyε
    laser speckle
    eyyε
    error/%
    500 638.70 564.81 11.57
    750 1028.67 1160.37 12.8
    1000 1739.87 1889.55 8.61
    1500 3725.88 4038.33 8.39
    2000 6306.47 6704.35 6.31
    2500 9023.73 9495.82 5.23
    2750 10178.13 10809.03 6.20

    Table 2.  Aluminum test piece under vacuum error of thermal strain eyy

    根据表 1表 2所示,铝试件在应变低于1200 με左右时,激光散斑与人工散斑计算结果相差较大;当应变值达到1200 με以上时,两者相差基本在10%以内。存在误差的主要原因有两个:(1)管式炉加热铝试件的设备并不能保证每次实验的温升曲线都完全重合,人工散斑和激光散斑两次实验的试件实际温度变化曲线本身就存在误差,导致图 6a图 6b中的热应变计算结果存在一个差值;(2)当试件温度较低时,热应变也比较小,DIC法在测量微小应变时的计算误差相对较大,但两种实验方法计算得到的热应变曲线基本一致,都能较好的反应出试件的热应变变化性能。

  • 为了考察激光散斑DIC法能否用于检测托卡马克装置中偏滤器钨(W)靶板受热流冲击产生的热应变,本文中在管式加热炉中分别对人工散斑与激光散斑的钨块试件进行真空加热,在加热过程中,CCD相机以1张/10 s的频率分别采集人工散斑图和激光散斑图各450张。对采集完的图像用PMLAB DIC软件计算并分析,并对获取的x方向应变exxy方向应变eyy曲线取平均值,获得的人工散斑和激光散斑平均应变曲线分别如图 7a图 7b所示。根据管式炉设备显示,温度随时间变化如图 7c所示。将获取的人工散斑与激光散斑平均应变曲线进行比较,如图 7d所示。

    Figure 7.  Strain change and heating process of W specimen

    根据图 7所示,钨试件的热应变同样呈现较好的金属各向同性,取图 7b激光散斑中1000 s,2000 s,3000 s,3500 s,4000 s,4500 s时间处xy方向上的热应变计算结果,与人工散斑计算得到的热应变量相比较,其绝对值差值百分比如表 3表 4所示。

    time/s artificial speckle
    exxε
    laser speckle
    exxε
    error/%
    1000 184.45 161.17 12.72
    2000 702.67 598.77 14.80
    3000 1814.61 1619.90 10.73
    3500 2382.81 2301.32 3.42
    4000 2979.46 3022.16 1.43
    4500 3634.15 3676.24 1.16

    Table 3.  Tungsten test piece under vacuum error of thermal strain exx

    time/s artificial speckle
    eyyε
    laser speckle
    eyyε
    error/%
    1000 210.65 174.81 17.01
    2000 758.89 619.74 18.33
    3000 1885.15 1687.30 10.5
    3500 2459.96 2387.57 2.94
    4000 3072.52 2950.41 3.97
    4500 3717.92 3597.12 3.25

    Table 4.  Tungsten test piece under vacuum error of thermal strain eyy

    根据表 3表 4所示,钨试件在应变低于1900 με左右时,激光散斑与人工散斑计算结果相差较大;当应变值达到1900 με以上时,两者相差基本在10%以内。存在误差的主要原因与铝相同:(1)管式炉加热钨试件时试件升温过程并不完全重合,人工散斑和激光散斑两次实验的试件实际温度变化曲线存在误差导致图 7a图 7b中的热应变计算结果存在一个差值;(2)热应变较小时,DIC法在测量微小应变时的计算噪声会相对较大,且与铝相比,钨的热膨胀系数要小得多,因此需要更高的温度,才会有更大的应变。但两种实验方法计算得到的热应变曲线在高温、大应变条件下,都能较好的反应出钨试件的热应变变化性能。

4.   结论
  • 针对人工散斑在高温环境下受热流冲击容易变形、脱落的问题,本文中采用激光散斑作为数字图像相关方法的散斑特征,对比了非真空环境下人工散斑和激光散斑的结果,可以看出,空气的热流扰动会影响激光散斑测量结果的精度,但可以通过平滑去噪获得相对准确的热应变结果。为了排除空气热流扰动的影响,针对铝和钨试件分别在真空管式加热炉中加热到450 ℃和800 ℃左右,并分别获取人工散斑和激光散斑图像进行计算,测量出两种金属的热应变动态变化过程。对比人工散斑和激光散斑的实验结果,并且通过钨材料在高温条件下的热应变DIC测量实验,初步验证了激光散斑DIC法用于托卡马克聚变堆偏滤器靶板热负荷检测分析的可行性,为聚变堆偏滤器第一壁材料的损伤诊断提供了新思路。

Reference (21)

Catalog

    /

    DownLoad:  Full-Size Img  PowerPoint
    Return
    Return