Study on measurement technology of shaft vibration based on electron-modulated laser coherent
-
摘要: 转轴振动的测量和监控是旋转机械故障分析和诊断的主要手段。为了实现便携式高精度的现场测量,提出了电子直接调制的激光多普勒相干转轴振动测量技术。通过对测量系统的分析,推导出数学模型。结果表明,直接调制激光束的频率,简化了测量光路,减小了体积,降低了成本;采用激光多普勒相干测量,达到高分辨率的要求;二次混频的设计,解决了电磁干扰下微弱信号不好直接处理的难题;取样积分技术的应用,改善了信噪比,使系统精确度更高;该系统的测量不确定度小于0.1%。这对智能化的现场测量具有一定指导意义。Abstract: The measurement and monitoring of the vibration of the rotating shaft are the main means of the fault analysis and diagnosis of the rotating machinery. In order to realize the portable and high precision field measurement, the technique of rotating shaft vibration measurement based on direct electron-modulation laser Doppler coherent was proposed. Through analysis of the measurement system, the mathematical model was derived.The results show that, direct modulation of the frequency of laser beam simplifies the measurement of optical path, reduces the volume and cost. The laser Doppler coherent measurement meets the high resolution requirements.The design of the second frequency-mixing solves the problem of direct processing of weak signals under electromagnetic interference. The application of sampling integration technique improves the signal to noise ratio and makes the system more accurate. The measurement uncertainty of the system is less than 0.1%.This study is of certain guiding significance for the intelligent field measurement.
-
引言
旋转机械转轴的振动测量和监控是故障分析和诊断的主要手段,随着旋转机械不断朝高转速和高精密的方向发展,对振动测量的要求也在不断提高[1]。近年来,随着激光器的发展,激光测振成为测振技术研究的主流,而其中激光多普勒测振技术又以其高精度和抗干扰能力强等优势成为研究的热点[2]。目前激光多普勒测振装置已有成熟的产品问世,但绝大多数都是国外研发的,并且价格昂贵测量成本较高。如美国OMS公司LaserPointLP01型振动测试仪就是应用激光多普勒效应,可以在5m工作距离内实现最小振动偏移0.1nm的精密测量,但因其使用声光调制技术[3],光路复杂、成本较高、普及性较差。为了在保证测量精度的前提下降低成本,实现便携式的现场测量,提出了电子直接调制的激光多普勒相干测量系统。通过电子直接调制激光束频率[4],克服了声光调制光路复杂的缺点,降低了成本、减小了体积,有利于便携的现场测量,通过二次混频和取样积分等信号处理措施,使测量系统的精度更高。
1. 理论分析和数学模型
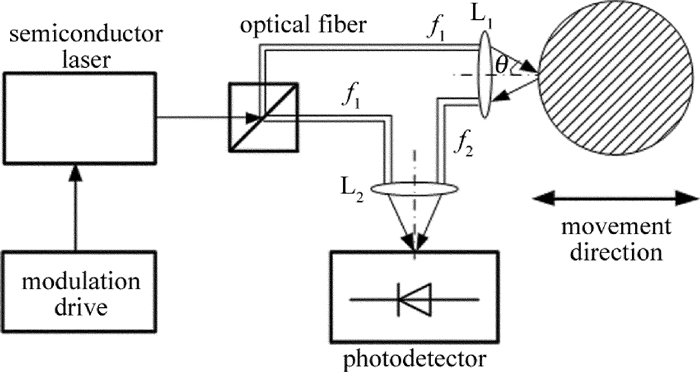
半导体激光器通过驱动电路的调制产生频率为f1的光束[5],经分光镜后分为频率相同的两束:其中一束作为测量光束经透镜L1汇聚于被测物体一点,被测物体特定方向的运动使光束产生多普勒频移并反射得到频率为f2的光束,经过透镜L2后被光电探测器接收; 另一束作为参考光束也经透镜L2后被光电探测器接收。f1和f2在以雪崩光敏二极管为核心的光电探测器上进行光学混频[6],实现相干测量。振动测量光路如图 1所示。
在测量光路中:
f1=f0+fm (1) f2=f0+fm+fD (2) 式中, f0为激光器固有频率; fm为调制频率,稳定在100MHz; fD为被测物体运动产生的多普勒频移[7]。多普勒频移与运动速度之间满足如下关系:
fD=2vxcosθ/λ (3) 式中, vx为被测物体在水平方向上的速率,θ为入射光线与被测点水平振动方向间的夹角,λ为激光波长[8]。光电探测器表面接收到频率分别为f1, f2的两束光,其合成的电场强度为:
E = {E_1}\cos \left( {2{\rm{ \mathsf{ π} }}{f_1}t + {\varphi _1}} \right) + {E_2}\cos \left( {2{\rm{ \mathsf{ π} }}{f_2}t + {\varphi _2}} \right) (4) 式中, E1和E2分别为两道光波照射到光电探测器表面的电场强度幅值;φ1和φ2分别为其初始相位;t为时间。由此可得其光学混频表达式为:
\begin{array}{*{20}{c}} {U\left( t \right) = {b_0} + {b_1}E + {b_2}{E^2} = }\\ {{b_0} + {b_1}{E_1}\cos \left( {2{\rm{ \mathsf{ π} }}{f_1}t + {\varphi _1}} \right) + {b_1}{E_2}\cos \left( {2{\rm{ \mathsf{ π} }}{f_2}t + {\varphi _2}} \right) + }\\ {\frac{1}{2}{b_2}E_1^2 + \frac{1}{2}{b_2}E_2^2 + \frac{1}{2}{b_2}E_1^2{{\cos }^2}\left( {2{\rm{ \mathsf{ π} }}{f_1}t + {\varphi _1}} \right) + }\\ {\frac{1}{2}{b_2}E_2^2{{\cos }^2}\left( {2{\rm{ \mathsf{ π} }}{f_2}t + {\varphi _2}} \right) + }\\ {{b_2}{E_1}{E_2}\cos \left[ {2{\rm{ \mathsf{ π} }}\left( {{f_1} + {f_2}} \right)t + \left( {{\varphi _1} + {\varphi _2}} \right)} \right] + }\\ {{b_2}{E_1}{E_2}\cos \left[ {2{\rm{ \mathsf{ π} }}\left( {{f_2} - {f_1}} \right)t + \left( {{\varphi _2} - {\varphi _1}} \right)} \right]} \end{array} (5) 式中, b0, b1和b2为常数,其具体数值和光电探测器自身参量有关。由于光电探测器无法响应1014数量级及以上的频率,所以上式中包含f1, f2, f1+f2项均无法响应,直流分量可以加电容滤除。因此光电探测器的输出仅为差频项:
U\left( t \right) = {b_2}{E_1}{E_2}\cos \left( {2{\rm{ \mathsf{ π} }}\Delta ft + \Delta \varphi } \right) (6) 因为f1和f2为相干光,所以(6)式中的两相干光的相位差Δφ为常数,可以通过相位补偿手段将其去除[9]。经过一系列的微弱信号处理之后,可得输出电压:
{U_{\rm{f}}}\left( t \right) = {U_0}\cos \left( {2{\rm{ \mathsf{ π} }}{f_{\rm{D}}}t} \right) (7) 系统嵌入STM32微处理器,经模数转换后通过快速傅里叶变换得到的频率即为多普勒频移fD。
由此可得被测物体在振动方向上的速度为:
{v_x} = \frac{\lambda }{{2\cos \theta }}{f_{\rm{D}}} (8) 积分可求得振动方向的位移,即:
X = \int {{v_x}{\rm{d}}t} = \frac{\lambda }{{2\cos \theta }}\int {{f_{\rm{D}}}{\rm{d}}t} (9) 2. 实验系统设计
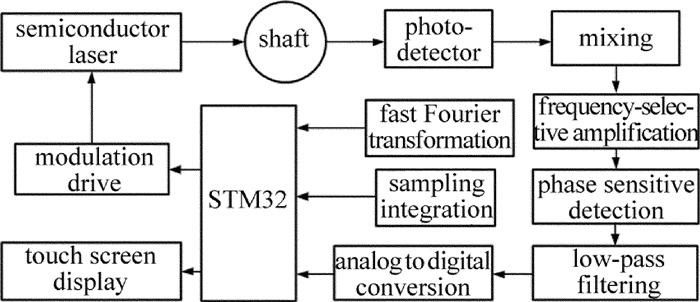
为了实现高分辨率、便携式的智能化测量,设计了本振动测量系统,其框图如图 2所示。
2.1 半导体激光器的频率调制
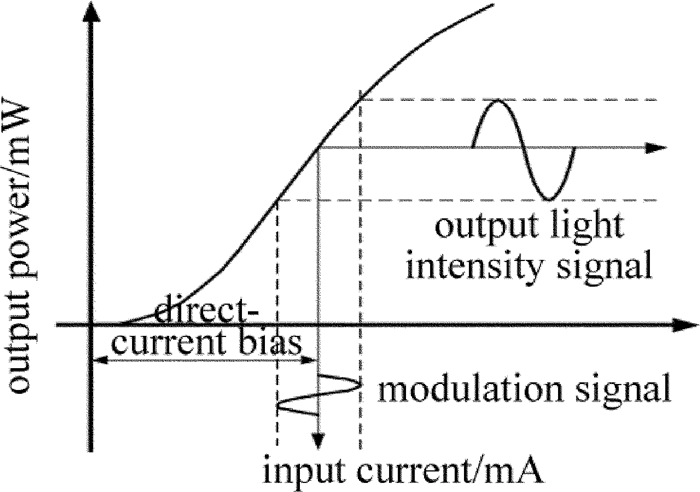
通过对半导体激光器注入电流的控制,就可以实现对光频率和光功率调制[10]。半导体激光器的注入电流与输出功率的关系如图 3所示。
假设半导体激光器的驱动电流为:
i = {I_0} + {I_{\rm{m}}}\cos \left( {2{\rm{ \mathsf{ π} }}{f_{\rm{i}}}t} \right) (10) 式中, I0和Im分别为直流偏置电流和调制电流峰值[11],fi为其频率。则半导体激光器的光频率为:
V = {V_0} + \eta {I_{\rm{m}}}\cos \left( {2{\rm{ \mathsf{ π} }}{f_{\rm{i}}}t} \right) (11) 式中, V0为偏置电流作用下基本光频率,比例系数η为驱动电流光频率调制率,仅与半导体激光器自身相关参量有关[12]。本系统选择法国Oxxius公司的稳频可调谐半导体激光器,通过驱动电路调制出稳定的100MHz正弦波。100MHz是经过慎重考虑选取的,一方面是半导体激光器在这个频段的调制性能最好,调制出的正弦波最稳定,另一方面就是相干性方面的考虑[13]。
2.2 二次混频
测量光和参考光在光电二极管上进行光学混频后得到差频信号,这种低频信号很微弱[14],极易受电磁干扰的影响而难以用常规的滤波放大方法准确提取处理有用信号,所以通过混频的方法将其频率搬移到中频fLO=10.7MHz可解决这个问题[15]。本部分先对测量信号进行滤波放大的预处理,然后在乘法器中与晶体振荡器产生的10.7MHz的本振信号进行混频,主要得到差频、和频以及谐波混频3种频率成分信号,通过选频滤波电路将和频信号取出,用常规的中频信号处理方法即可对其进行后续处理。二次混频处理过程如图 4所示。
3. 实验数据分析及技术措施
通过目前发布的转轴振动标准可知,优先选择的转轴振动测量是位移,而以测量方向上的振动位移峰-峰值SPP作为评定指标,SPP为系统测得最大位移和最小位移之差,由微处理器对数据处理后同时频信号一起显示在触摸屏上。受限于实验室的条件,用LaserPointLP01型振动测试仪和本测量系统对JX-3B型标准振动台进行振动测量,形成对比实验。
Table 1. The maximum peak-peak vibration before enhancementSPP/μm 20Hz 40Hz 80Hz 160Hz 320Hz LP01 8.0910 8.1022 8.1534 7.9826 8.0323 system 8.1013 8.1271 8.1716 7.9701 8.0454 LaserPointLP01型振动测试仪测得数据平均值为S1 =8.0723μm,实验系统所测得数据平均值S2 =8.0831μm,由此得系统相对误差为:
e = \frac{{\overline {{S_2}} - \overline {{S_1}} }}{{\overline {{S_1}} }} \times 100\% = 0.1338\% (12) 通过实验数据可得测量系统相对误差为0.1338%,并未达到系统设计的要求,为了在此基础上进一步提高精度,系统采用取样积分技术滤除干扰噪声[16]。其工作原理是对连续N个周期内同一部分的信号进行采样累加平均,干扰噪声大多是非周期信号,会得到抑制,抑制程度取决于取样的累积次数N,而测量系统的信噪比可改善 \sqrt{N}倍。本测量系统采用模拟多点信号平均器,具有复现波形频率高、成本低、性能稳定等优点。具体参量选择如下:每个周期取样240个点,有效积分时间为5ms,取样脉宽取为0.4ns,则取样积分的累积次数为1.25×10⁷,信噪比的改善大于1000倍,并可以控制整个系统的测量时间小于0.01s,满足系统响应时间的要求。改进后的测量系统实验数据如表 2所示。
Table 2. The maximum peak-peak vibration after enhancementSPP/um 20Hz 40Hz 80Hz 160Hz 320Hz LP01 8.1025 8.0872 8.1826 7.9265 8.0272 system 8.1087 8.0956 8.1952 7.9243 8.0352 由(12)式计算可得改进后的系统相对误差为0.0818%,满足小于0.1%的测量系统设计要求。
经过多次实验得到测量系统的主要技术参量如表 3所示。
Table 3. Main technical parameters of the measurement systemdisplacement range frequency range working distance speed range 0.1nm~ 10mm DC> 20kHz 1cm~50cm 5μm/s~ 500mm/s 4. 不确定度评定
4.1 激光光源引起的不确定度u(λ)
本系统中采用633nm可调谐的半导体激光器,直接调制后的光波稳定性小于0.06%,用矩形分布估计其不确度为3.46×10⁻⁴。
4.2 夹角θ引起的不确定度u(θ)
在进行数据处理时假定入射光线和反射光线与传感器振动方向的夹角不变。但实际上由于距离原因该夹角是在(θ-Δθ)~(θ+Δθ)之间变化的,最大误差限为0.06%,用三角分布可估算其不确定度为2.45×10⁻⁴。
4.3 光电探测器引起的不确定度u(d)[17]
本系统选择的硅光电探测器的波长范围为400nm~ 1000nm,扩展不确定度为0.08%,置信概率p=99%,包含因子k=2.576,所以可得由光电探测器导致的标准不确定度为3.11×10⁻⁴。
4.4 信号处理过程引起的不确定度u(i)
二次混频和取样积分等处理手段使系统信噪比得到极大改善,经实验验证这一部分产生的误差实验测量得电路产生的误差不高于0.05%,用正态分布估计其不确定度为1.67×10⁻⁴。
4.5 外界因素引起的不确定度u(o)
在校准过程中,系统受到外界温度、湿度、杂散光等干扰,实验结果表明这部分误差总体小于0.08%,用正态分布估计其不确定度为2.67×10⁻⁴。
因此,合成标准不确定度为:
\begin{array}{*{20}{c}} {{u_{\rm{c}}} = \sqrt {u{{\left( \lambda \right)}^2} + u{{\left( \theta \right)}^2} + u{{\left( d \right)}^2} + u{{\left( i \right)}^2} + u{{\left( o \right)}^2}} = }\\ {0.0613\% < 0.1\% } \end{array} (13) 由此可得系统的不确定度小于0.1%,达到设计要求。
5. 结论
在理论分析的基础上,提出了电子直接调制的激光多普勒相干转轴振动测量技术并设计了实验系统。通过电子直接调制,克服了声光调制的诸多缺点,降低了成本,增强了适用性;二次混频的处理方法,巧妙的解决了在电磁干扰下难以用常规的滤波放大方法准确提取处理有用信号的技术局限;取样积分技术的应用,提高了信噪比,使系统达到更高的精度。经实验分析可知,此系统分辨率高、动态性能好、抗干扰能力强,对环境相对复杂的现场测量有着广阔的应用前景。
-
Table 1 The maximum peak-peak vibration before enhancement
SPP/μm 20Hz 40Hz 80Hz 160Hz 320Hz LP01 8.0910 8.1022 8.1534 7.9826 8.0323 system 8.1013 8.1271 8.1716 7.9701 8.0454 Table 2 The maximum peak-peak vibration after enhancement
SPP/um 20Hz 40Hz 80Hz 160Hz 320Hz LP01 8.1025 8.0872 8.1826 7.9265 8.0272 system 8.1087 8.0956 8.1952 7.9243 8.0352 Table 3 Main technical parameters of the measurement system
displacement range frequency range working distance speed range 0.1nm~ 10mm DC> 20kHz 1cm~50cm 5μm/s~ 500mm/s -
[1] TONG Q B, MA H P, LIU L H, et al. Key technology study on radial vibration detection system of high-speed rotating machinery[J]. Chinese Journal of Scientific Instrument, 2011, 32(5):1026-1032(in Chinese). http://www.wanfangdata.com.cn/details/detail.do?_type=perio&id=yqyb201105011
[2] CASTELLINI P, MARTARELLI M, TOMASINI E P. Laser Doppler vibrometry:development of advanced solutions answering to technology's needs[J]. Mechanical Systems & Signal Processing, 2006, 20(6):1265-1285. http://www.sciencedirect.com/science/article/pii/S0888327005002220
[3] DU Zh J, WANG H L. Study on measuring technology of vibration displacement based on optical-fiber acousto-optic modulation[J]. Laser Journal, 2015, 36(12):85-87(in Chinese). http://d.old.wanfangdata.com.cn/Periodical/jgzz201512020
[4] JIA F X, DING Zh L, YUAN F. Design on high frequency amplitude modulation of laser diode[J]. Infrared and Laser Engineering, 2007, 37(11):1174-1177(in Chinese). http://www.wanfangdata.com.cn/details/detail.do?_type=perio&id=jgyhw200711013
[5] ZHANG Ch. Drive circuit design of modulation semiconductor laser[J]. Electro-Optic Technology Application, 2013, 28(6):71-73(in Chinese). http://en.cnki.com.cn/Article_en/CJFDTOTAL-GDYG201306017.htm
[6] ZHAN Y Sh, REN J, TAN Sh B. Studies of optoelectronic heterodyne detection with avalanche photodiode[J]. Journal of Xidian University, 1996, 23(2):171-175(in Chinese). http://www.wanfangdata.com.cn/details/detail.do?_type=perio&id=QK199600566566
[7] HUO L, ZENG X D, AN Y M, et al. Vibration measurement and analysis by means of laser Doppler heterodyne principle[J]. Laser Technology, 2011, 35(5):600-602(in Chinese). http://www.wanfangdata.com.cn/details/detail.do?_type=perio&id=jgjs201105007
[8] DONG Y L, WANG H L. Study on measuring technology of surface profile based on electronic modulation coherence[J]. Laser & Optoelectronics Progress, 2016, 53(1):011201(in Chinese). http://www.sciencedirect.com/science/article/pii/S0262885616300348
[9] ZHANG H Y, ZHAO Ch M, YANG S H. The methods of decreasing the phase noise influence in micro-Doppler ladar[J].Acta Photonica Sinica, 2011, 40(5):753-757(in Chinese). DOI: 10.3788/gzxb
[10] WANG H L, DONG Y L. Study on measuring technology of surface profile based on electronic modulation coherence[J]. Laser Technology, 2016, 40(3):447-450(in Chinese). http://www.sciencedirect.com/science/article/pii/S0262885616300348
[11] WANG D H, HUANG H. Electrical driving source for semiconductor lasers for optic fiber sensors based on direct frequency modulation principle. Laser Journal, 2011, 32(1):32-34(in Chinese). http://www.wanfangdata.com.cn/details/detail.do?_type=perio&id=jgzz201101014
[12] LUO Y, XU J M, HUANG J, et al. High speed semiconductor light sources based on direct modulation and external modulation[J]. Infrared and Laser Engineering, 2008, 37(2):200-204(in Chinese). http://www.wanfangdata.com.cn/details/detail.do?_type=perio&id=hwyjggc200802003
[13] LI H Ch, HE Y Ch, ZHOU H. Coherence of a direct modulating diode laser[J]. Applied Laser, 1994, 14(4):161-163(in Chinese). http://en.cnki.com.cn/Article_en/CJFDTotal-YYJG404.005.htm
[14] JIANG G Zh, JIANG Ch. Study on the principle and way of detection[J]. Journal of Hubei Normal University(Natural Science Edition), 2001, 21(4):45-48(in Chinese). http://d.old.wanfangdata.com.cn/OAPaper/oai_doaj-articles_d6b93e3e681a44182e5410b4491e63b1
[15] WU P, SHEN B, ZHENG Y P, et al. Design of a low-frequency and low-noise spectrum move circuit[J]. Electrical Measurement & Instrumentation, 2010, 47(2):73-76(in Chinese). http://en.cnki.com.cn/Article_en/CJFDTOTAL-DCYQ201002019.htm
[16] LI Y, YANG B J, TAN L, et al. The united detecting method of sampling integral and chaotic system for the weak periodic pulse signals[J]. Journal of Electronics & Information Technology, 2003, 25(12):1653-1657(in Chinese). http://www.wanfangdata.com.cn/details/detail.do?_type=perio&id=dzkxxk200312012
[17] NI Y C. Practical measurement of uncertainty evaluation[M]. Beijing:China Metrology Press, 2008:68-77(in Chinese).
-
期刊类型引用(6)
1. 王红敏,罗自赢,李蕾,彭俊玲. 平行度误差激光准直法测量技术研究. 激光技术. 2022(05): 674-684 .  本站查看
本站查看
2. 马俊,曹成度,闵阳,周吕. SINS/GNSS组合导航系统中激光多普勒测速仪参数估计. 激光杂志. 2021(03): 47-51 .  百度学术
百度学术
3. 项东升,康长青. 基于解调处理的光纤光栅传感器振动智能抑制系统设计. 现代电子技术. 2021(09): 182-186 .  百度学术
百度学术
4. 秦正健,王辉林,张守宇,曹泉泉,宋华峣. 自相关处理的光纤多普勒流体测速系统的研究. 激光杂志. 2020(01): 22-25 .  百度学术
百度学术
5. 张守宇,王辉林,秦正健,宋华峣,曹泉泉. 全光纤声光调制粗糙度相关测量技术研究. 激光杂志. 2020(02): 25-28 .  百度学术
百度学术
6. 马天兵,高飞彪,陈南南. 基于双目视觉的柔性悬臂梁振动测量研究. 传感器与微系统. 2020(08): 23-25+29 .  百度学术
百度学术
其他类型引用(2)


 下载:
下载:


